Reporting
Reporting provides set of various out of box dashboards comprising multiple visuals (table, graph, trends, and so on.) depicting the overview of automation activities.
Accessing the Reports
You can access the reporting page only with the relevant access.
- Open the Admin Module using valid credentials.
- Click the
 (Reporting) icon or Reporting.
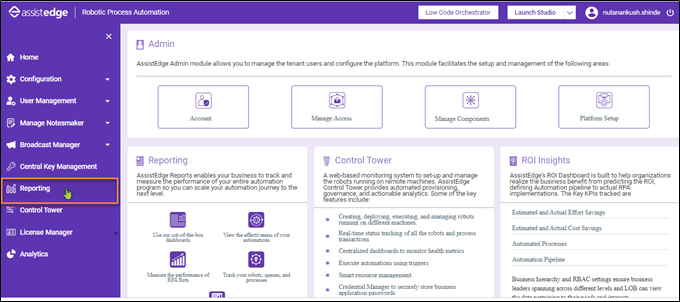
The Reporting page is displayed.
- The Reports page of Admin module opens. This page contains following tabs:
- Discover: Discover displays the raw transactional data of the configured index patterns in the form of json document.
- Visualize: Visualize is used to view already created report or one can create custom reports. You can create different types of visualization such as graphs, pie-charts, data-tables and so on.
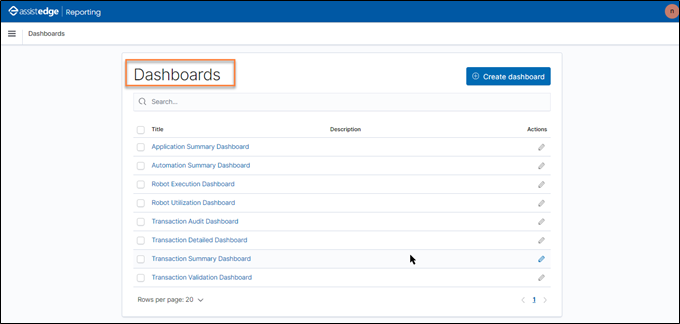
- Dashboard: Dashboard is used to view already created Dashboard or you can create new Dashboard. Dashboard is a collection of visualizations, which is a logical group of reports for showing an insight. The following dashboards are part of AssistEdge RPA:
- To know more about the AE RPA out of box reports, see Dashboard section.
- Management: Management is used to manage index pattern, indices and so on.
Session Time expires
In-case, user has logged in to system for longer time without any action and also session time expires then, user will be directed to Reporting login page.