Visualize
AssistEdge RPA provides various out-of-box reports around bots, processes, transactions and so on. Visualize is used to create reports and visualize the data in the form of graphs, pie-charts, data-tables and so on.
Following are AE RPA out of the box reports, which are part of the Out of the box Dashboards (covered in the Dashboards Section):
- Automation Summary Dashboard
- Robot Execution Dashboard
- Robot Utilization Dashboard
- Transaction Summary Dashboard
- Application Summary Dashboard
- Transaction Validation Dashboard
- Transaction Detailed Dashboard
- Transaction Audit Dashboard
To know more about the AE RPA out of box reports, see Dashboard section.
Prerequisite to Access Visualize
Logged-in user role should have relevant permission to edit or view the visualize tab. For more information about the role access, see Specify role access section in Administrator.
Accessing the Visualize page
To access the visualize page:
Navigate to Reports tab > Visualize.
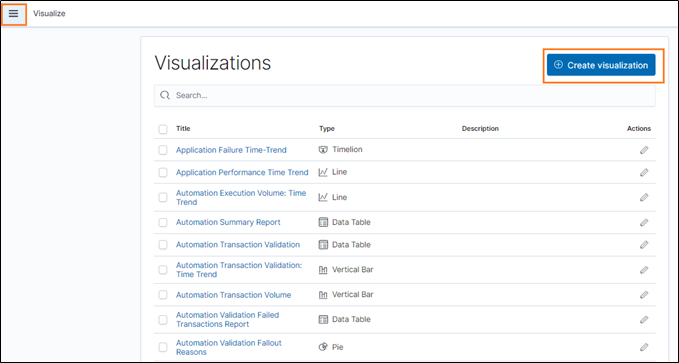
The list of AE RPA out of box reports are displayed. To know more about the AE RPA out of box reports, see Dashboard section.
Creating a New Visualization or Reports
When you go to the Visualize tab, you can see a list of visualization. You can visualize the data you have in the form of bar charts, pie charts, line graphs and so on. Using the Visualization, you can create a new report. For more information about creating a new visualization or reports, see Creating a Visualization section in Kibana website.