Robot Execution Dashboard
Robot Execution Dashboard tracks the summary report, transaction execution, execution volume and average execution time trend.
The dashboard consists of the following tabular and graphical reports:
- Bot Summary Report
- Transaction Execution: Bot View
- Bot Execution Volume
- Robot Average Execution Time: Time Trend
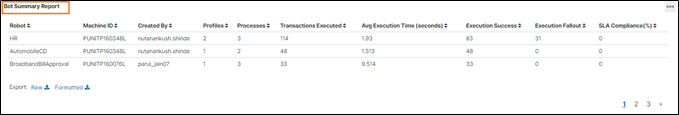
Bot Summary Report
Bot Summary Report displays the total number of transactional requests executed by individual robots across the profile during a particular period along with their efficiency.
Following is a sample Bot Summary Report:
Following is the field description of Bot Summary Report:
| Reports Fields | Description |
| Robot | Indicates the name of Robot which is executing the automation requests. |
| Machine ID | Indicates the Machine ID on which the robot is deployed. |
| Created By | Indicates the name of user who has created the robot. |
| Profiles | Indicates the number of profiles which are assigned to the robot. |
| Processes | Indicates the number of processes which are assigned to the robot. |
| Transaction Executed | Indicates the number of transactions for which the automation requests are executed. |
| Avg Execution Time (Seconds) | Indicates the average time a robot takes to execute a qualified request (Robot Execution End Time – Robot Execution Start Time). |
| Execution Success | Indicates the number of transactions which are successfully executed. |
| Execution Fallout | Indicates the number of transactions which are failed while execution. |
| SLA Compliance (%) | Indicates the percentage of SLA compliance (whether the execution of a particular transaction request in a process got completed successfully within the defined SLA time. The SLA time of any process can be defined at the time of deployment in Automation Studio.) |
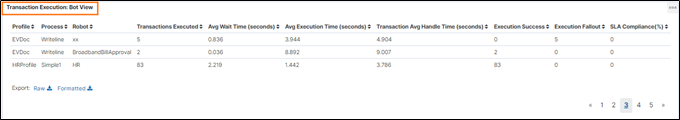
Transaction Execution: Bot View
Transaction Execution: Bot View report provides a tabular representation of robot-wise execution status of incoming requests, validated as qualified automation for each of the processes.
Following is a sample Transaction Execution: Bot View report:
Following table contains the Key Performance Indicators (KPIs) used in this report:
| Reports fields | Description |
| Profile | Indicates the name of profile which are assigned to the robot. |
| Process | Indicates the name of process which are assigned to the robot. |
| Robot | Indicates the number of robots deployed to execute the automation of qualified transaction requests for a particular process. |
| Transactions Executed | Indicates the number of requests received in a particular process validated as qualified for automation and sent to robots for execution. |
| Avg Wait Time (seconds) | Indicates the average time duration between the request received by the robot for execution and the time when robot actually starts executing the request. |
| Avg Execution Time (seconds) | Indicates the average time a robot takes to execute a qualified request (Robot Execution End Time – Robot Execution Start Time) |
| Transaction Avg Handle Time (seconds) | The average time a request takes to be executed. It is calculated as (Robot Execution End Time – Listener Start Time). |
| Execution Success | Indicates the number of requests which are executed completely by a robot (execution ended gracefully). |
| Execution Fallout | Indicates the number of requests which fail to execute completely by a robot because of one or more errors mentioned in the Execution Success and Execution Failure section of the Transaction Execution Dashboard. |
| SLA Compliance (%) | Validates whether a particular automation request was completed and successfully executed within the defined SLA timeline. The process SLA can be defined at the time of deploying a process in the Automation Studio. |
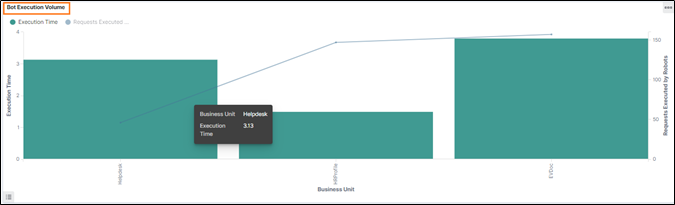
Bot Execution Volume
Bot Execution Volume report tracks the average handle time taken by the bots to execute automation requests of processes of individual profile. It displays how the digital workforce resource is utilized across the profile. Apply a filter on individual robots for detailed study of bot utilization across the profiles.
Following is a sample Bot Execution Volume report:
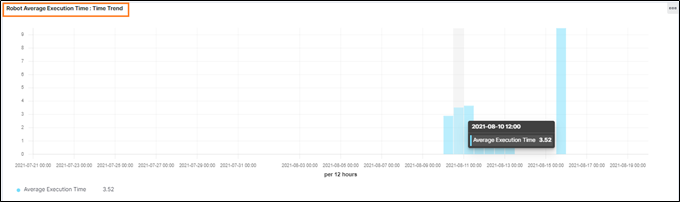
Robot Average Execution Time: Time Trend
Robot Average Execution Time: Time Trend report tracks the average execution time taken by each robot to execute the transaction requests assigned to it during the chosen period.
Following is a sample Robot Average Execution Time: Time Trend report.