Visualize
AssistEdge RPA provides various out-of-box reports around bots, processes, transactions and so on. Visualize is used to create reports and visualize the data in the form of graphs, pie-charts, data-tables and so on.
Following are AE RPA out of the box reports, which are part of the Out of the box Dashboards (covered in the Dashboards Section):
- Automation Summary Dashboard
- Robot Execution Dashboard
- Robot Utilization Dashboard
- Transaction Summary Dashboard
- Application Summary Dashboard
- Transaction Validation Dashboard
- Transaction Detailed Dashboard
- Transaction Audit Dashboard
To know more about the AE RPA out of box reports, see Dashboard section.
Prerequisite to Access Visualize
Logged-in user role should have relevant permission to edit or view the visualize tab. For more information about the role access, see Specify role access section in AE-RPA-Administrator Guide.
Accessing the Visualize page
To access the visualize page:
Navigate to Reports tab > Visualize.
The list of AE RPA out of box reports are displayed. To know more about the AE RPA out of box reports, see Dashboard section.
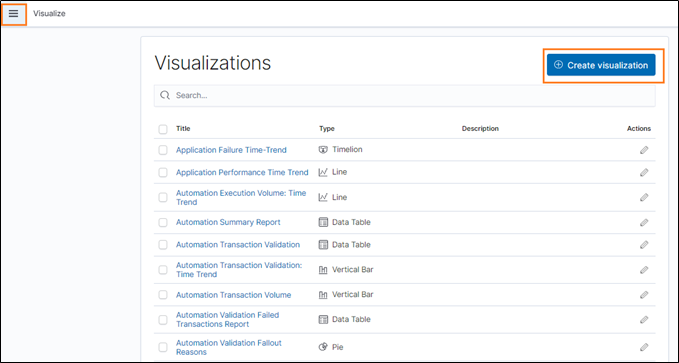
Creating a New Visualization or Reports
When you go to the Visualize tab, you can see a list of visualization. You can visualize the data you have in the form of bar charts, pie charts, line graphs and so on. Using the Visualization, you can create a new report. For more information about creating a new visualization or reports, see Creating a Visualization section in Kibana website.