Transaction Summary Dashboard
Following reports are covered in this dashboard, such as:
- Transaction Execution: Profile View
- Transaction Execution: Process View
- Transaction Average Handle Time: Time Trend
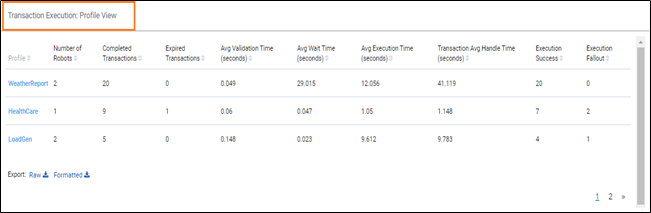
Transaction Execution: Profile View
Transaction Execution: Profile View report provides a tabular representation for the profile-wise execution status of incoming requests, validated as qualified for automation and so on.
Following is a sample Transaction Execution: Profile View report:
Following is the field description of Transaction Execution: Profile View report:
| Reports fields | Description |
| Profile | Indicates the name of profile which are assigned to the robot. |
| Number of Robots | Indicates the number of robots deployed within a particular profile to execute the requests. |
| Completed Transactions | Indicates the number of requests received within a particular profile which are validated as qualified for automation and are sent to robots for execution. |
| Expired Transactions | Indicates the number of success validation transactions which expired in the queue itself, before any robot picked up for the execution. |
| Avg Validation Time (seconds) | Indicates the average time duration between, when a request is received by the system and when it is declared as qualified or rejected for automation. These data are shown in seconds. |
| Avg Wait Time | Indicates the average time duration between the request received by the robot for execution and the time when robot actually starts executing the request. |
| Avg Execution Time (seconds) | Indicates the average time a robot takes to execute a qualified request (Robot Execution End Time – Robot Execution Start Time). |
| Transaction Avg Handle Time | The average time a request takes to be executed. It is calculated as (Robot Execution End Time – Listener Start Time). |
| Execution Success | Indicates the number of requests which are executed completely by a Robot (with the execution ending gracefully). |
| Execution Fallout | Indicates the number of requests which were not executed completely by a robot, because of one or more errors mentioned in the Execution Success and Execution Failure section of the Transaction Execution Dashboard. |
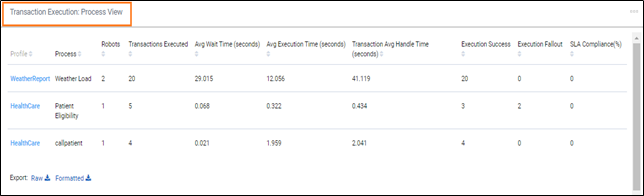
Transaction Execution: Process View
Transaction Execution: Process View report provides a tabular representation of process-wise execution status of incoming requests, validated as qualified for automation.
Following is a sample Transaction Execution: Process View report:
Following table contains the Key Performance Indicators (KPIs) used in this report:
| Reports fields | Description |
| Profile | Indicates the name of profile which are assigned to the robot. |
| Process | Indicates the name of process which are assigned to the robot. |
| Robots | Indicates the number of robots deployed to execute the automation of qualified transaction requests for a particular process. |
| Transactions Executed | Indicates the number of requests received within a particular profile which are validated as qualified for automation and are sent to robots for execution. |
| Avg Wait Time (seconds) | Indicates the average time duration between the request received by the robot for execution and the time when robot actually starts executing the request. |
| Avg Execution Time (seconds) | Indicates the average time a robot takes to execute a qualified request (Robot Execution End Time – Robot Execution Start Time). |
| Transaction Avg Handle Time (seconds) | Indicates the average time taken to execute a request. Transaction Avg Handle Time is calculated as (Robot Execution End Time – Listener Start Time). |
| Execution Success | Indicates the number of requests which are executed completely and without any error (ending gracefully). |
| Execution Fallout | Indicates the number of requests which fail to execute completely by a robot because of one or more errors mentioned in the Execution Success and Execution Failure section of the Transaction Execution Dashboard. |
| SLA Compliance (%) | Validates whether a particular automation request was completed and successfully executed within the defined SLA timeline. The process SLA can be defined at the time of deploying a process in the Automation Studio. |
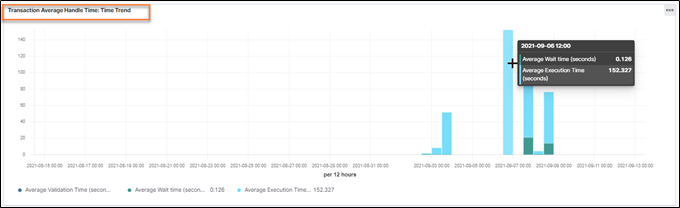
Transaction Average Handle Time: Time Trend
Transaction Average Handle Time: Time Trend report is used to analyze the time trend view of the average handle time to execute automation qualified requests for the chosen time duration across processes.
This report displays the stacked bar chart of average validation time, average wait time, and average execution time over the time duration chosen. All the time values are measured in seconds.
Following is a sample Transaction Average Handle Time: Time Trend:
Following are the three columns displayed in this graph:
| Trend- Reports | Description |
| Avg Validation Time | Indicates the average of the time duration between when a request is received by the system and when it is declared as qualified or rejected for automation. |
| Avg Wait Time | Indicates the average time duration between the request received by the robot for execution and the time when robot actually starts executing the request. |
| Avg Execution Time | Indicates the average time a robot takes to execute a qualified request (Robot Execution End Time – Robot Execution Start Time). |