Application Summary Dashboard
Automation Summary Dashboard captures information such as:
- A number of profiles subscribed to the automation program and overall effectiveness.
- Number of bots deployed to execute each process and their performance.
- Number of request successfully executed
The Automation Summary Dashboard comprises of four distinct reports which includes tabular and graphical reports, such as:
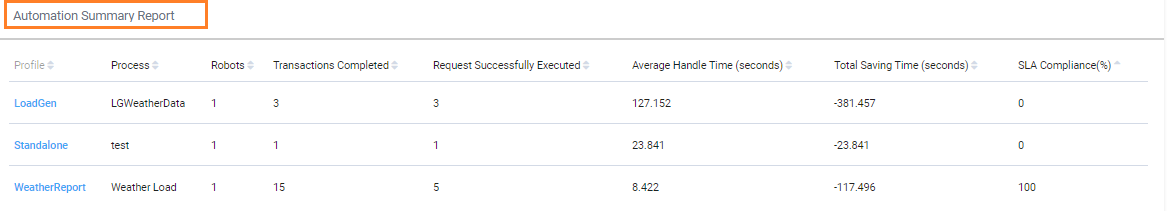
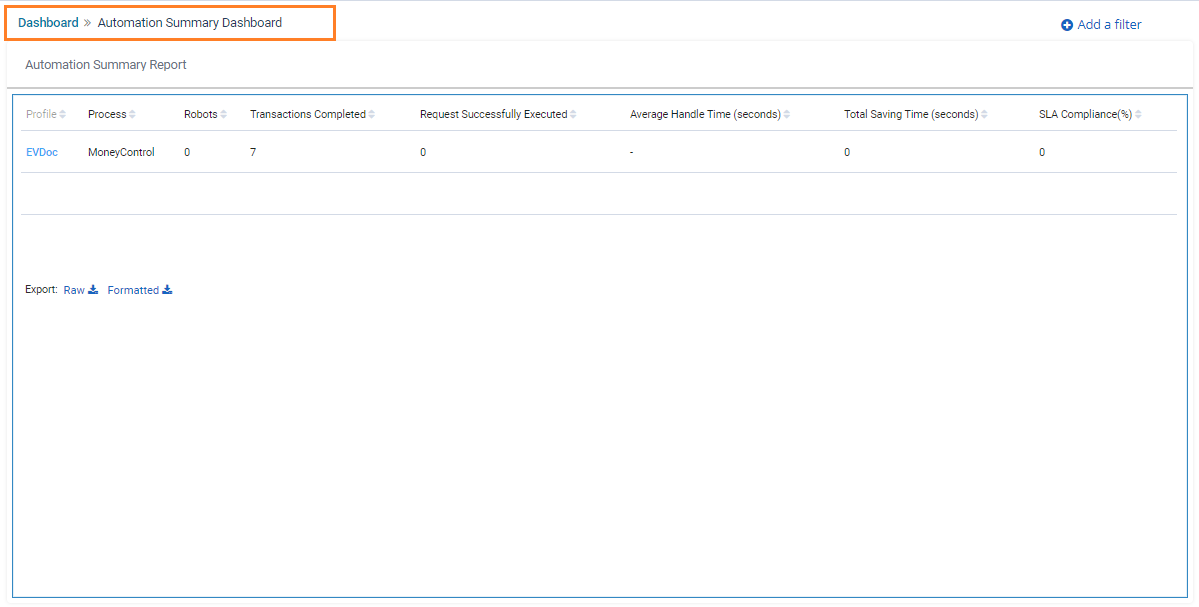
Automation Summary Report
The Automation Summary Report displays the list of profiles subscribed to the automation program along with their configured processes.
|
NOTE: |
By default, profiles and process are grouped by size of top <5> profiles and top <50> processes against the profiles. If there are more than <50> processes for a given profiles, then only top <50> processes are shown. If user want to see more processes, then user can go to the individual visualization and change the size to view more number of records. This behavior is applicable for all the reports in which the rows are grouped on the basis of terms, like, Robots, profiles, Process, Transaction Id, and so on. |
Following is a sample automation summary report:
Following table provides the report - field descriptions:
|
Reports fields |
Description |
|
Profile |
Indicates the name of profile. Profiles are the part of entity hierarchy. Users, processes and applications are mapped to the profile. |
|
Process |
Indicates the name of process. |
|
Robots |
Indicates the name of robots. |
|
Transactions Completed |
Indicates that for a particular request only once the automation transaction can be performed. |
|
Request Successfully Executed |
Indicates the automation requests volume received and processed successfully. |
|
Average Handle Time (seconds) |
Indicates the average time required to execute the automation requests for the chosen time duration across processes. |
|
Total Saving Time (seconds) |
Indicates the positive value of Total saving (Time) suggests that Automating the process has resulted in reduction in handle time of the process as compared to the manual handling time. Negative value indicates the exact opposite. The Total Saving time of any process can be defined at the time of deployment in Automation Studio. |
|
SLA Compliance(%) |
Indicates the percentage of SLA compliance (whether the execution of a particular transaction request in a process got completed successfully within the defined SLA time. The SLA time of any process can be defined at the time of deployment in Automation Studio.) |
Downloading Reports
Additionally, you can download the reports in raw or formatted format.
To download the raw or formatted reports:
- On the <Automation Summary Report>, click Raw or Formatted.
![]()
- The preferred report in .CSV format will be downloaded in your system.
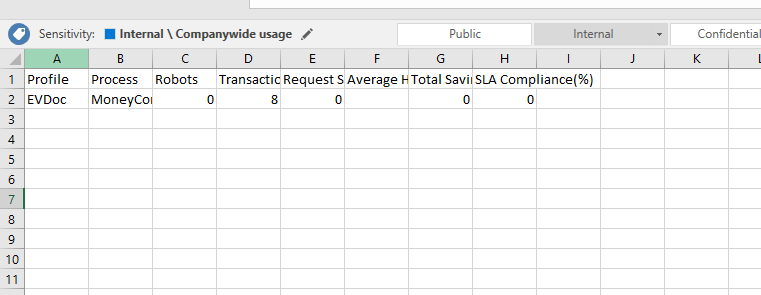
The Automation Summary report- excel sheet contains information such as profile name, process, robots, transactions completed, and so on.
Reports - Options
Reports - options enables you to view the full screen report, and inspect the report.
To view the options in reports:
Click  (OPTIONS) to view the reports details.
From the OPTIONS, click Inspect to view the <Automation Summary Report>.
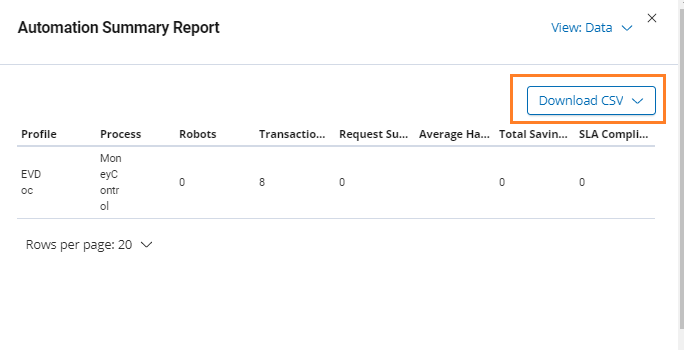
The <Automation Summary Report> page is displayed. This page shows rows details such as profile, process, robots, transactions executed and so on.
Additionally, you can also download the report - CSV file in raw and formatted format. For more information about downloading CSV, see Dashboard#Downloading_Reports
From the OPTIONS, click Full Screen to view the <Automation Summary Report>.
The <Automation Summary Report> page is displayed.
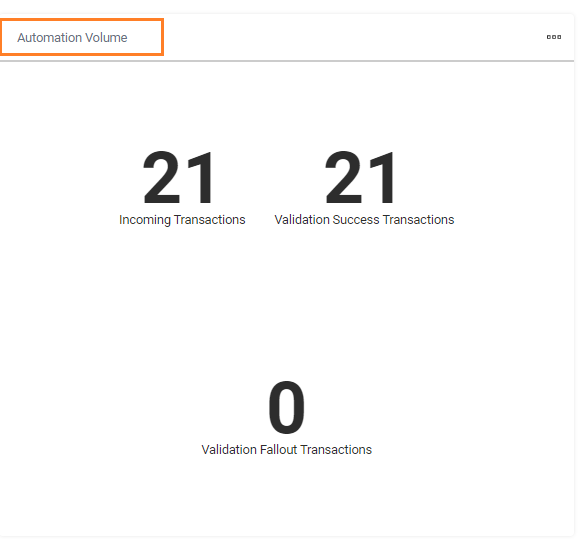
Automation Volume
Automation Volume Report shows the aggregated number of automation requests received across processes, and their funnel- type distribution into different execution statuses. It helps the user to assess the overall health of automation execution activities and helps to track the fallout reasons.
Following is a sample Automation Volume Report:
Following is the field description of Automation Volume Reports:
|
Reports fields |
Description |
|
Incoming Transactions |
Indicates the aggregated number of automation request received across the process. |
|
Validation Success Transactions |
Indicates the number of automation requests which are validated as qualified for automation and would be sent to robots for execution. |
|
Validation-Fallout Transactions |
Indicates the number of automation requests which are validated and not qualified for automation and will not be sent to robot for execution. |
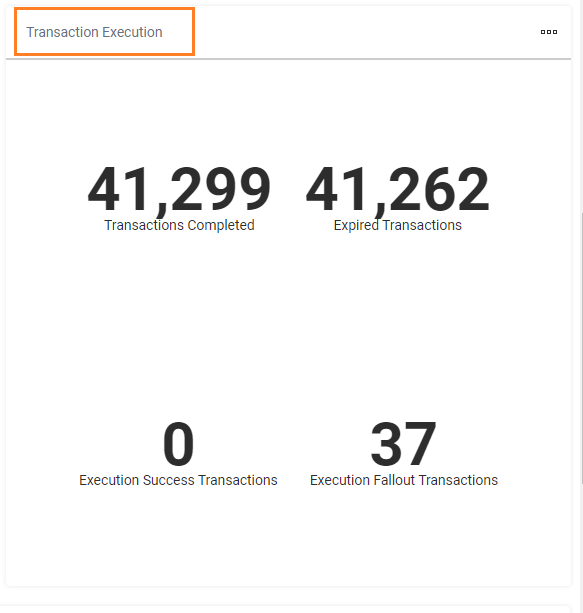
Transaction Execution Report
Transaction Execution Report helps the user to assess the overall health of automation execution activities. It also shows the number of transactions fallout while execution.
Following is a sample Transaction Execution report:
Following is the field description of Transaction Execution Report:
|
Reports fields |
Description |
|
Transactions Completed |
Indicates the number of transactions completed. |
|
Expired Transactions |
Indicates the number of validation success transactions which got expired in queue itself before any robot could pick it for execution. |
|
Execution Success Transactions |
Indicates the number of transactions which are successfully executed by the robot. |
|
Execution Fallout Transactions |
No. of requests which could not get executed completely by robot because of some error mentioned in Execution Success and Execution Failure section of Transaction Execution Dashboard. |
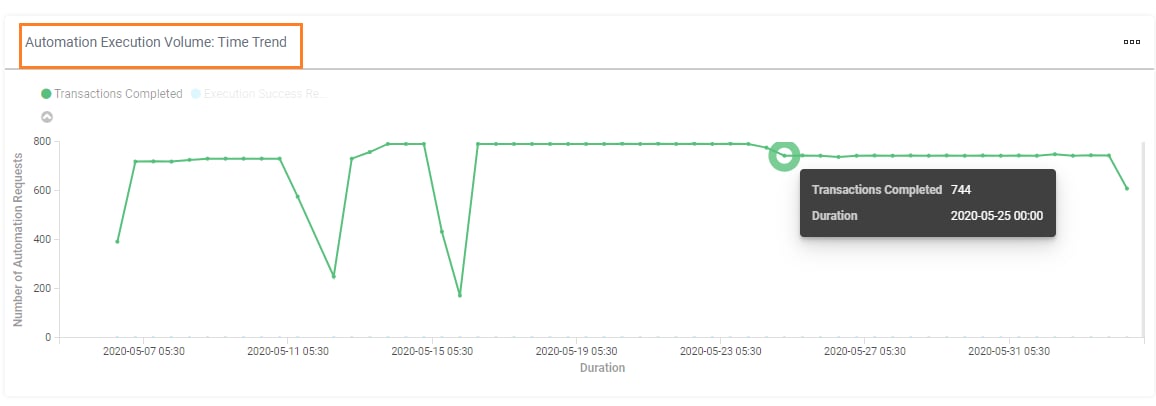
Automation Execution Volume: Time Trend
Automation Execution Volume: Time Trend report displays the validation success transactions (automatable requests) volume, and compares it through a line chart with the execution success transactions across time during the chosen period. Additionally, it helps to identify any patterns in incoming requests volume and plan the number of robots in advance to handle the surge in the volume of incoming requests.
Following is a sample Automation Execution Volume: Time Trend report.