Accessing Dashboard
To access the dashboard page, login to Admin Module:
Navigate to Reporting > Dashboard.
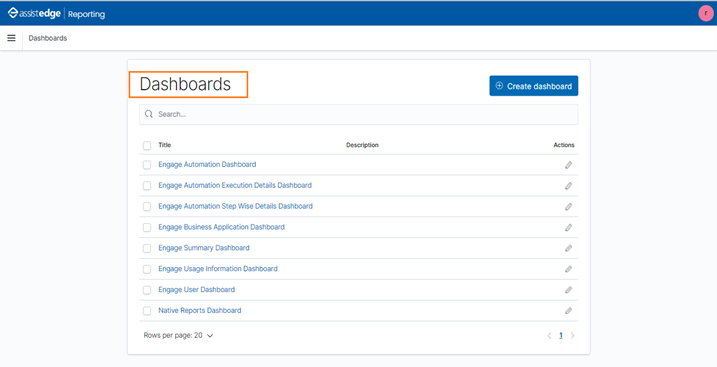
Follow the below steps if you want to apply filter on the data that is displayed in the reports.
- Click the desired dashboard link on the Dashboard home page.
- Click Add a filter.
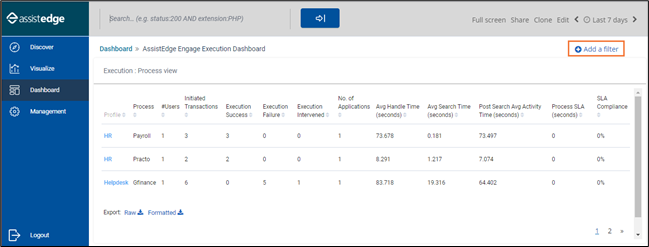
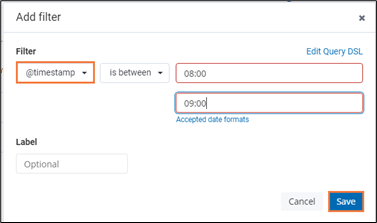
The Add filter window appears. Select the required filter, enter the inputs, and click Save.
- In the Filter drop-down list, select the required filter criteria. Based on the selected criteria, the other fields appear where you can provide the inputs.
Based on the applied filter, the data is displayed in the generated report.
If any time filter is applied, transactions for the applied time filter is shown. For example – Time filter is applied to view data from 08:00 till 09:00 and no transactions will have initiated in this duration thus initiated transactions would show zero, however if any transaction initiated before 08:00 and gets executed at 08:15 will come under execution success, execution failure or execution intervened based on transaction output however it is not reflected under Initiated Transactions for the applied time filter.
NOTE:
Filter Data: Filter should always be applied on Transaction ID field to extract data. If filter is applied on any other field than transaction id, then according to applied filter only partial data is shown.
Out-of-the-Box Dashboards
Click the preferred dashboard to view the corresponding operational insights. Dashboard tab displays the following out-of-the-box dashboards. Click the link below to view the details:
- Engage Summary Dashboard
- Engage User Dashboard
- Engage Automation Dashboard
- Engage Automation Execution Details Dashboard
- Engage Business Application Dashboard
- Engage Usage Information Dashboard
- Native Reports Dashboard
- Engage Automation Step Wise Details Dashboard