Engage Summary Dashboard
Following reports are available in the Summary View:
- Process Summary Report
- Users Performance Summary
- Execution Volume: Time Trends
- Process Automation: Execution Status
Process Summary Report
This report provides a summary view of the process with respect to time spent on each process with details on time spent in search and post search activities i.e. the time before starting a new search.
Total number of users who have search request for each of the process and number of search requests with details of status (Success, Failure, Intervened).
Process SLA defined and the percentage of search requests with reference to overall search requests which meet the SLA.
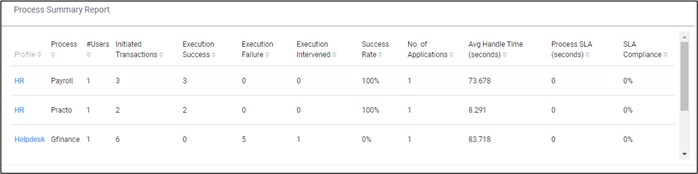
Following table provides the report fields description.
| Field Name | Description |
| Profile | Indicates the name of the profile. |
| Process | Indicates the name of the process. |
| #Users | Shows the number of the users working on the process. |
| Initiated Transactions | Indicates the total number of transactions initiated in that particular process. |
| Execution Success | Indicates the total number of transactions that were successful in that particular process. |
| Execution Failure | Indicates the total number of transactions that were failed in that particular process. |
| Execution Intervened | Indicates the total number of transactions initiated but could not be completed. |
| Success Rate | Shows the percentage of the successful transaction/automations. |
| No. of Applications | Indicates the total number of applications in which automation is done for a process. |
| Avg Handle Time | Indicates the average time spent on all the transactions. |
| Process SLA | Indicates the expected execution time configured in Studio. |
| SLA Compliance | Indicates the percentage of time a particular automation request was completed and successfully executed within the defined SLA timeline. The process SLA can be defined at the time of deploying a process in the Automation Studio. |
Users Performance Summary
- Number of search requests executed by each user with details of time spent on execution and time spent on other activities before starting the new search i.e. post search activity time.
- Total search requests with details of successful, failed and intervened transactions.

Following table provides the report fields description.
| Field Name | Description |
| User | Indicates the name of the user working on the process. |
| Profile | Indicates the number of the profiles. |
| Process | Indicates the number of the process(es) you are working on. |
| Initiated Transaction | Indicates the number of transactions that are initiated. |
| Execution Success | Indicates the total number of transactions that were successful in that particular process. |
| Execution Failure | Indicates the total number of transactions that were failed in that particular process. |
| Execution Intervened | Indicates the total number of transactions initiated but could not be completed. |
| Average Execution Time (seconds) | Indicates the average automation time spent across all the transactions. |
| Average Handle Time (seconds) | Indicates the average time spent on all the transactions. |
| SLA Compliance | Indicates the percentage of time a particular automation request was completed and successfully executed within the defined SLA timeline. The process SLA can be defined at the time of deploying a process in the Automation Studio. |
Execution Volume: Time Trends
- Time trend of all the transactions that are executed.
- Details for all initiated and successful transactions with average handle time.
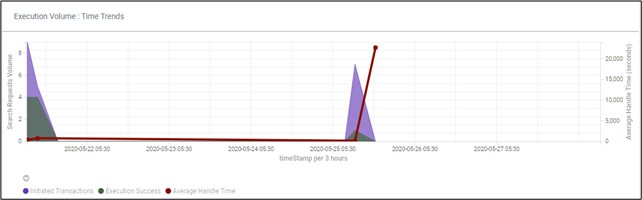
Following table provides the report fields description.
| Field Name | Description |
| Search Request Volume | Indicates the number of search requests. |
| timeStamp per 3 hours | Displays the date and time when the data was captured at a duration of every three hours. |
Execution Time Split: Time Trends
Time for all the processes executed in Enterprise Personal Assistant, with details of time spent on search and post search activities.
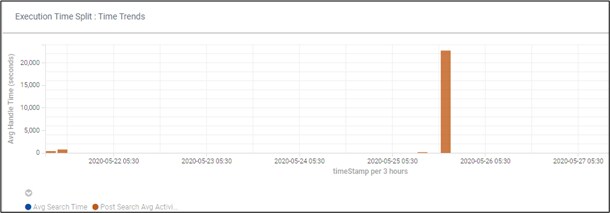
Following table provides the report fields description.
| Field Name | Description |
| Avg Handle Time (seconds) | Indicates the time required for process execution with search and post search activities. |
| timeStamp per 3 hours | Displays the date and time when the data was captured at a duration of every three hours. |
Process Automation: Execution Status
Quick glance view of the percentage of successful, failed and intervened requests in overall automation requests is shown which can be used to analyze the performance of the automation program.
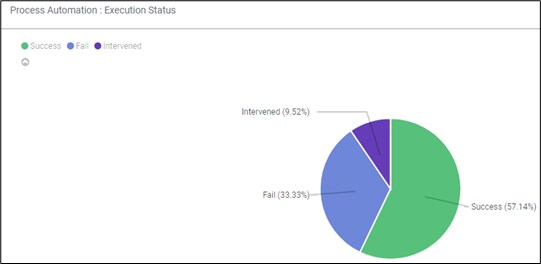
Following table provides the report fields description.
| Field Name | Description |
| Success | Indicates the percentage of successful automations. |
| Fail | Indicates the percentage of failed automations. |
| Intervened | Indicates the percentage of intervened automations. |