Engage Business Application Dashboard
Following reports are available in the Business Application View:
- Process Automation Execution: Application Failure View
- Process Automation Execution: Application Time Trend
- Application Access Time Trend
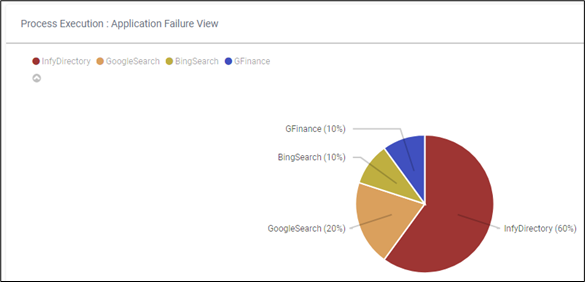
Process Automation Execution: Application Failure View
This report displays the percentage of the failed transactions for each application. This can be utilized to find out the maximum failed transactions and improve the performance of the error prone applications.
Process Automation Execution: Application Time Trend
- The average time taken by each application during the request execution which gives a view to decide time spent on each application.
- This view gives details on which application is used the most during the automation.
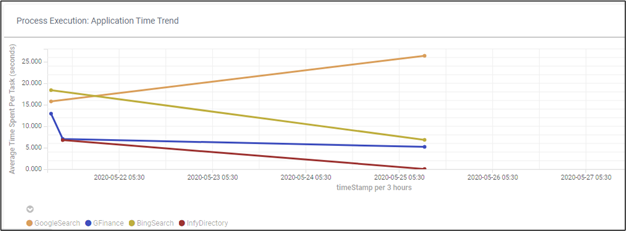
Following table provides the report fields description:
| Field Name | Description |
| Average Time Spent Per Task | Indicates the average time (in seconds) spent on each process. |
| timeStamp per 3 hours | Displays the date and time when the data was captured at a duration of every three hours. |
Application Access Time Trend
The average time spent on individual application by the user apart from the search time, these are usually post search activities.
This view gives details on which application is referred the most post execution and helps in giving a general idea on applications load.
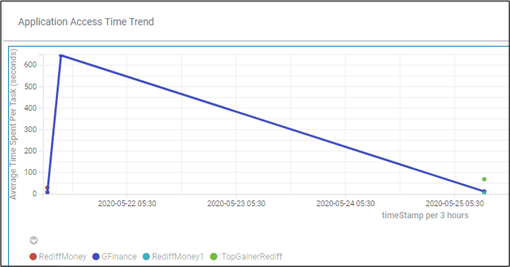
Following table provides the report fields description:
| Field Name | Description |
| Average Time Spent Per Task | Indicates the average time (in seconds) spent on each process. |
| timeStamp per 3 hours | Displays the date and time when the data was captured at a duration of every three hours. |