Robot Details View
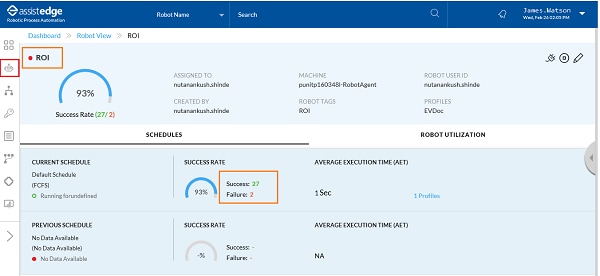
Robot details view page displays the details of a robot such as scheduled run and activity logs of execution request. Select any of the robot to view the robot details. The robot details view page includes the following details:
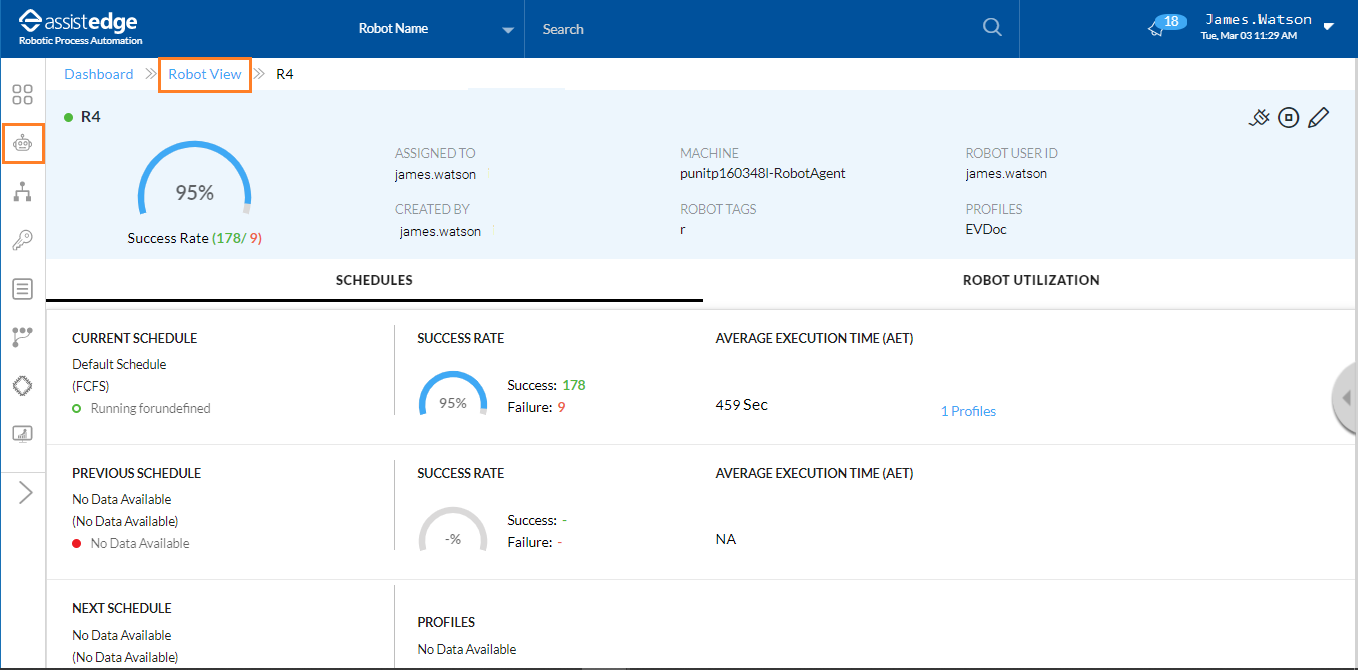
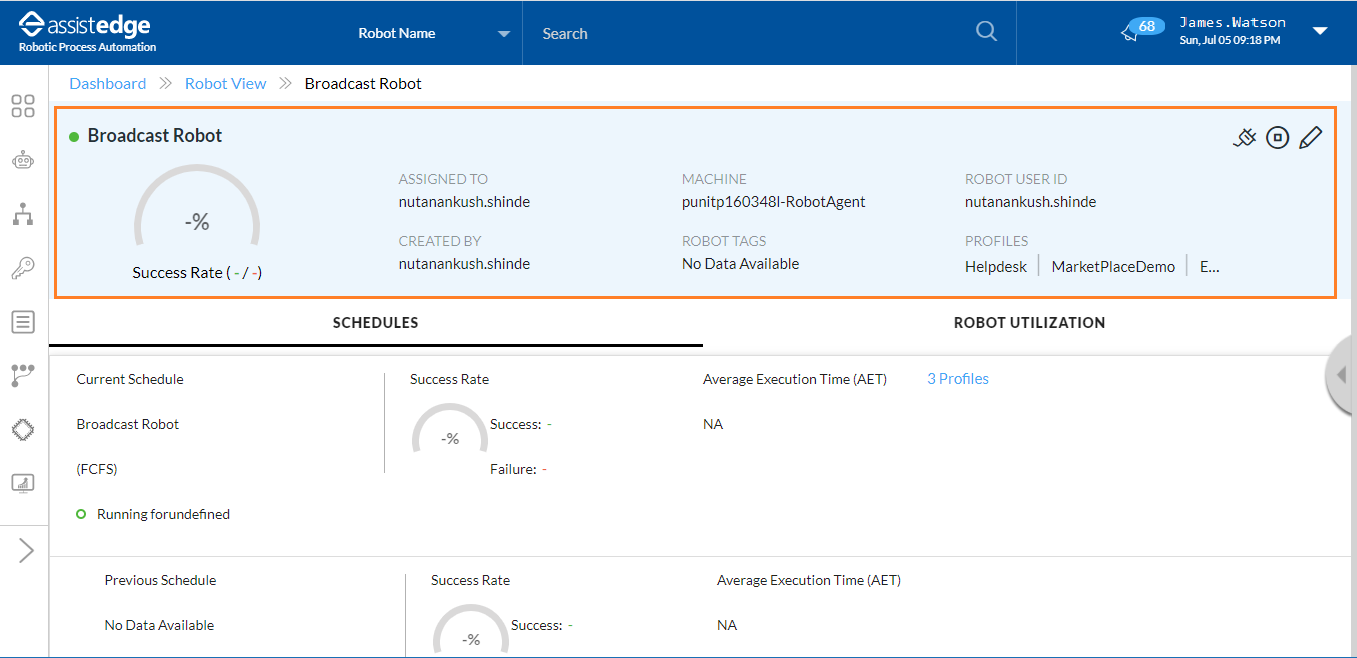
Top section
The robot details top section displays following details:
· <Robot Name>: Displays the name of the robot.
· Current Status Indicator: The gear shows the current status of the robot.
· Assigned To: Displays the name of user to whom robot is assigned.
· Created By: Displays the robot owner name.
· Machine: Displays the machine on which the robot is deployed.
· Robot Tags: Displays the robot tags, if provided while the robot creation.
· Robot User ID: Displays the User ID used to take the ownership of the robot.
· Profiles: Displays the profile which robot is supposed to listen in the current schedule.
· Additionally, you can set Disconnect, Stop or Edit the robot details. For more information about Robot Actions, see Robot Actions section.
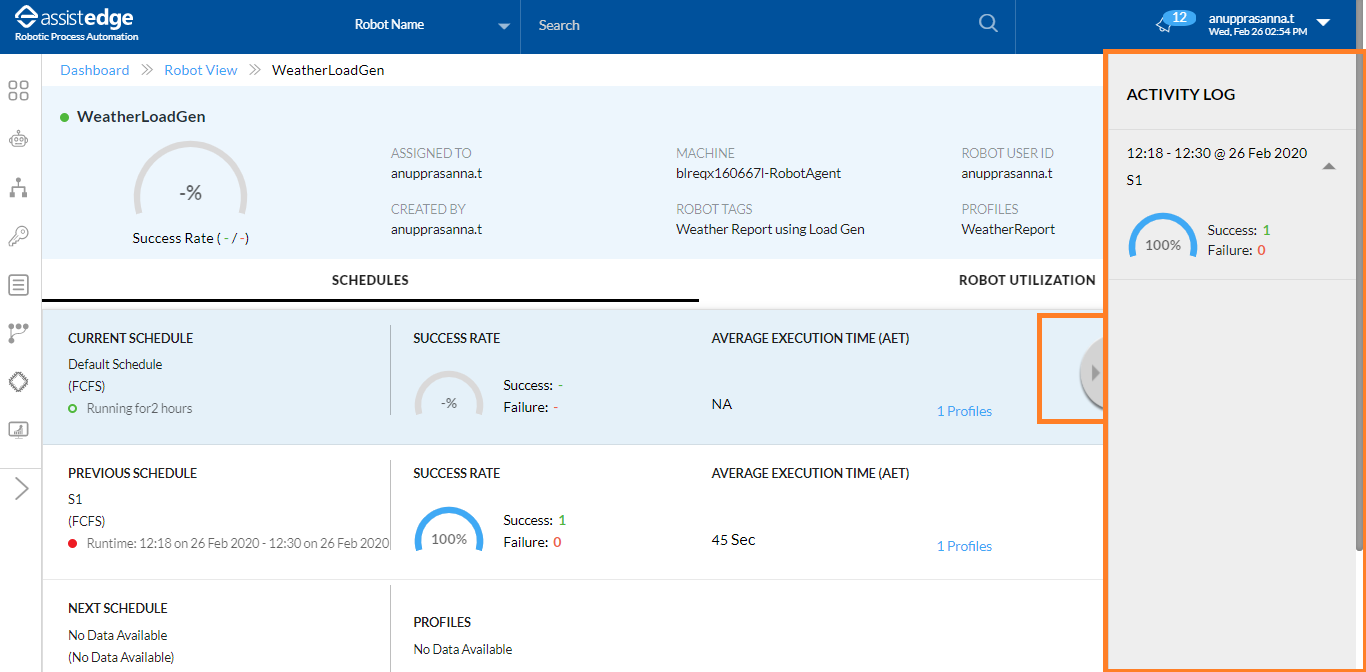
Activity Logs
Activity Logs panel displays success rate and transaction details schedules which are executed and expired during the last7 days.
To view the activity logs:
1. Click
the (Activity
logs) icon.
(Activity
logs) icon.
2. The activity logs panel appears displays the following information:
a. Success and failure numbers from activity logs
b. Current and previous schedules
Schedules
The Schedules tab displays the details of the current schedule, previous schedule (last schedule which robot has executed) and the next schedule.
Only the robot owner can create new schedules for the robot. Additionally, robot owner can edit or delete the existing schedules of the robot.
For more details the schedules for the robot, see Schedules.
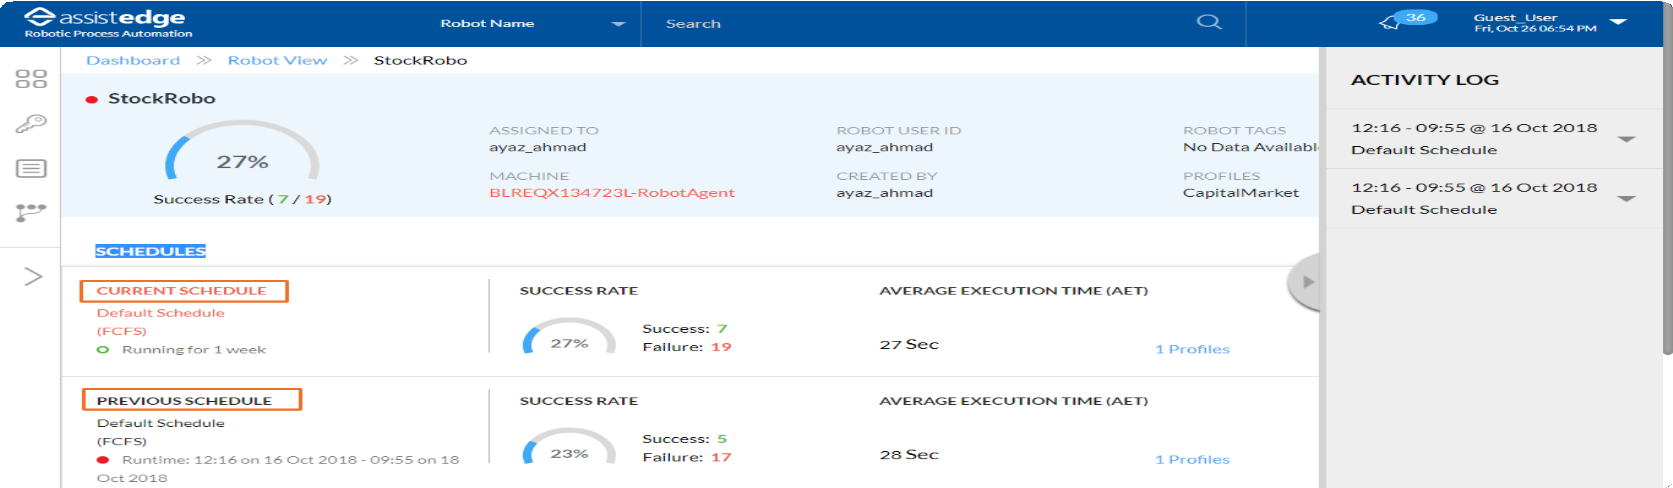
Robot Transactions
Robot View transactions page displays the information about the robot transactions such as specific status, description, time stamp and so on. Additionally, you can download the list of transactions.
To view the robot transactions:
1. In the Robot View-Transactions, select Schedules tab, click Success or Failures numbers to view the respective robot transactions.
The Robot View page for the selected robot is displayed.
2. In the Robot View Transaction tab, you can switch between various tabs such as:
§ All Transactions: Displays all the robot transaction details.
§ Success: Displays only the information related to success rate of the robot transactions.
§ Failure: Displays only the information related to failure robot transactions.
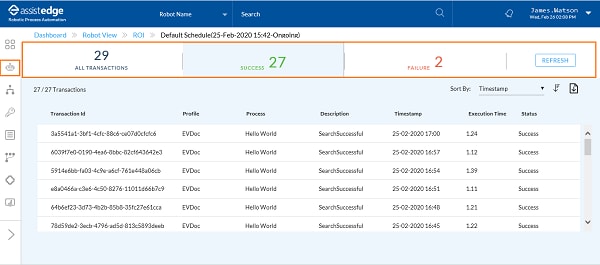
Following is the field description of robot transaction page:
Column Header |
Description |
Transaction ID |
Displays the unique transaction ID of the transaction. |
Profile |
Displays the profile mapped to the automation process. |
Process |
Displays the automation process for which automation request has been executed. |
Description |
Displays the brief description about how the transaction ended up. You can configure the text to be shown in this field for a specific error type in App/RPA-ControlTower/ Public/JS/Config.js. |
Timestamp |
The time stamp of when the latest transaction occured by an RPA component. |
Execution Time |
Time taken by a robot to execute the transaction. |
Status |
Displays the success or failure status of the transaction. |
Refresh |
Enables you to refresh the robot transactions list. |
3. In the Robot Transactions details page, you can do the following:
· Using the Search option, you can search for the robot transactions.
· In the Sort by list, select the preferred option. Additionally, you can sort the transaction list as per the available sorting criteria such as:
§ Transaction ID
§ Profile
§ Process
§ Description
§ Timestamp
§ Execution Time
§ Status
· Click
the  (Download)
icon to export the robot transaction details in the CSV format.
(Download)
icon to export the robot transaction details in the CSV format.
4. In the Robot Transaction view page, Transaction ID and Description values are linked. If you click the link, you are navigated to that particular Robots Transaction Details page. Click <Transaction ID> to view the details of the transactions.
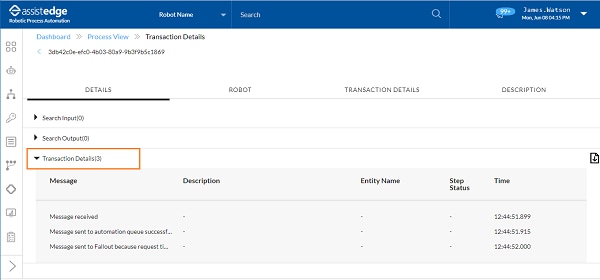
The Transaction Details page is displayed. You can switch between the tabs to view the robot transaction details as the available information includes:
a. Top: At the top, the robot transaction details is displayed, which includes Process, Profile, Robot Name, and Status. For more information about robot transaction details, see Robot Transaction Field Description section.
b. DETAILS Tab: Displays the following robot transaction details information as following:
§ Search Inputs and Search Outputs: Displays the details of the process inputs, outputs, and details of each step performed through the transaction journey.
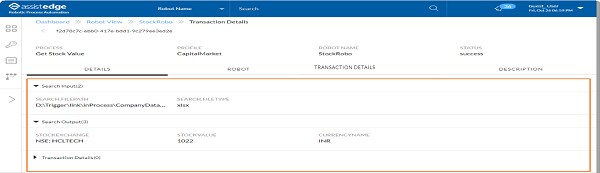
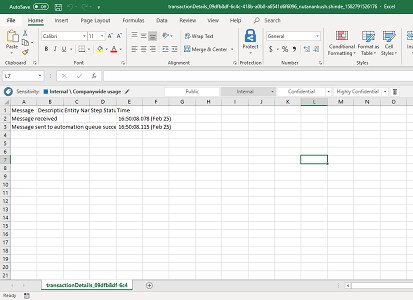
§ Transaction Details: Displays information such as Message, Description, Entity Name, Step Status and Time.
§ Download: Click the (Download) icon to export the
robot transaction details in the CSV format. The transaction details
excel sheet will be downloaded to your system. Following
is an example of the downloaded file that contains robot transaction
details.
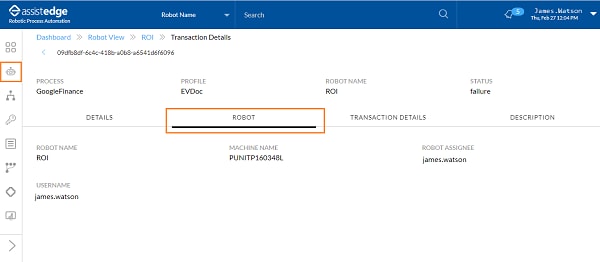
c. ROBOT Tab: Displays information such as name of the robot and machine, robot assignee, and the username of the assignee. For more information about the Robot Tab fields, see Field Description of Robot.
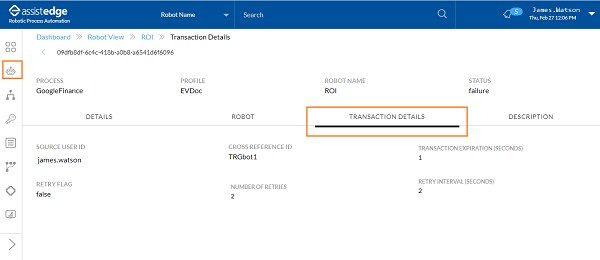
d. TRANSACTION DETAILS Tab: Displays information such as Source User ID, Cross Reference ID, Transaction Expiration (Seconds), Retry Flag, Number of Retries, and Retry Intervals (Seconds).
e. DESCRIPTION Tab: Displays information such as error code, description, error type and retry valid.

All Schedules
This section of the Robot View >> <Robot name> page includes the transaction details of all the schedules. This tab displays information such as the name of the schedule, schedule for robot to execute the process, profiles mapped to the robot, and the success rate of the robot. For more information about all schedules, see field description of all schedules.
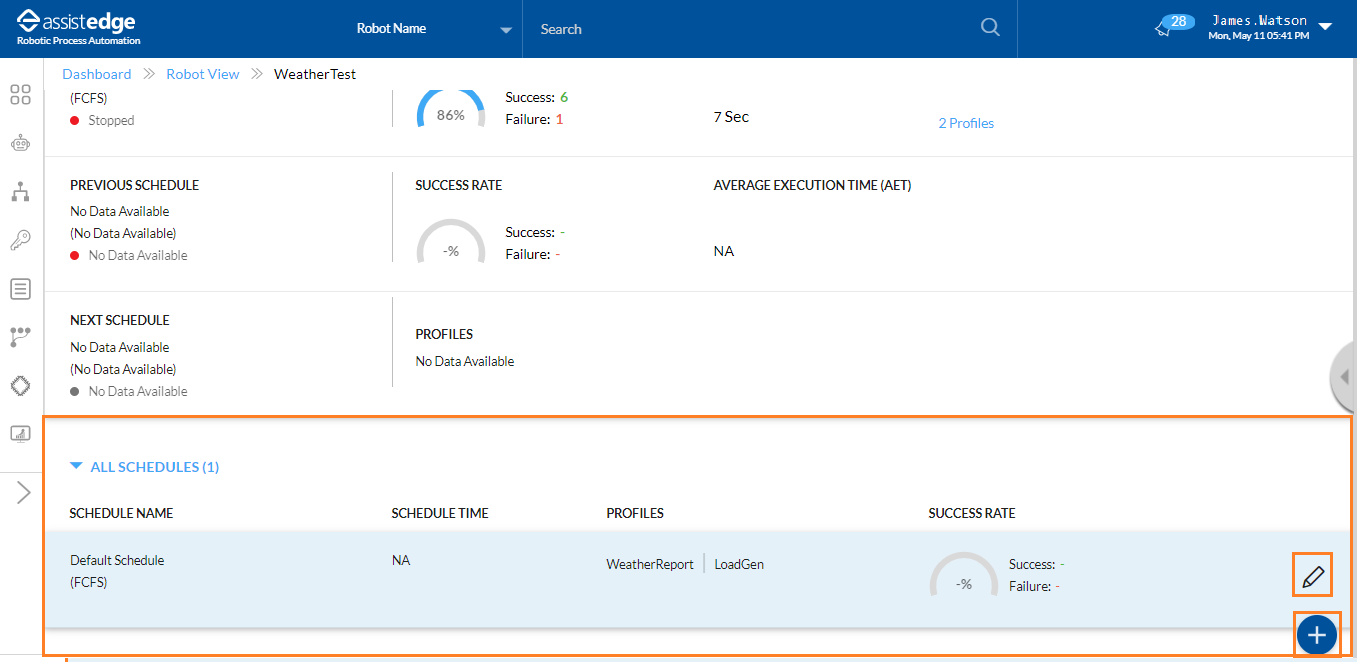
In the Stopped Robot View > Robot Transaction view, you can perform the following actions:
· Click  to add a new schedule for the
robot.
to add a new schedule for the
robot.
· Additionally, you can edit the schedules.
For more information about schedules, see Default_Schedule or Custom_Schedule.
Robot Utilization
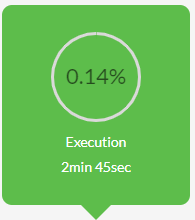
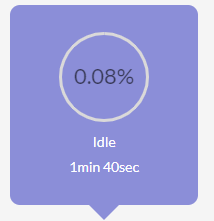
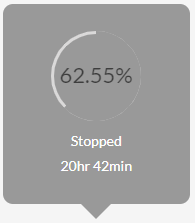
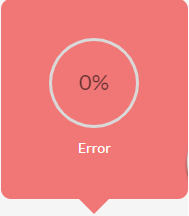
The Robot Details page includes the robot utilization details. In the Robot Utilization section, you can view the Robot Statuses and Robot Trends. Additionally, it displays the percentage of time spent by robot in different statuses such as Availability, Setup, Execution, Idle, Stopped, Error, and Unavailability.
To view the robot utilization:
1. Click the specific Status Block, to view the time trend of robot in a specific status over the last 7 days.
For example, Execution block is selected in the image below.
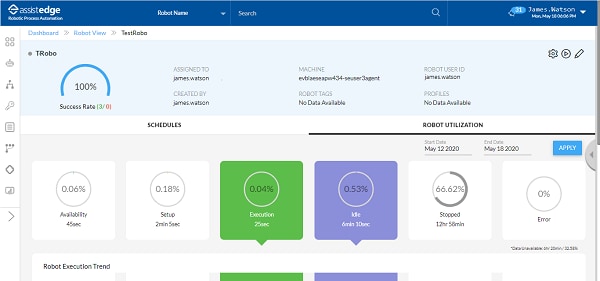
The Robot Execution Trend is displayed for the selected status.
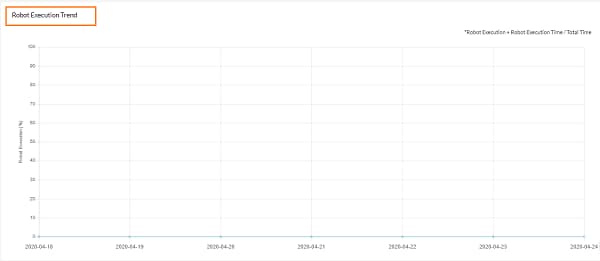
Following table shows different statuses displayed in Robot Utilization:
Status |
Description |
Available %
|
Indicates the duration (in percentage) for which the robot was available in Available status. Available state implies that the robot was available in common pool from where it was assigned to control tower user with the relevant access. |
Setup %
|
Indicates the duration (in percentage) for which the robot was in Setup status. Setup state implies that robot was not owned by any user to perform the required processes. |
Execution %
|
Indicates the duration (in percentage) for which the robot was executing the process. |
Idle %
|
Indicates the duration (in percentage) for which the robot was not executing any process and waiting to pickup any automation request. |
Stopped %
|
Indicates the duration (in percentage) for which the robot was stopped and was not working on any automation request. |
Error %
|
Indicates the duration (in percentage) for which either the robot was not able to pick up the automation request or request failed to execute. |
Data Unavailable |
Indicates that the robot was in Unavailable state, due to following reasons: · VM or Machine (on which the robot agent was running) is down · Robot agent not running · Robot Agent's connection with server is lost For the duration that, the robot was unavailable, a status is shown as *Data Unavailable: 6hr 20min/32.58% on the page. Once the robot moves to unavailable state, the status data is populated every 15 minutes. |
NOTE: |
The duration (in percentage) for each statuses is captured only till 2 decimal points. Hence, the sum of percentage may not add up to 100%. It’s aggregation may lead to a value between 99-100%. |
2. You can filter and view the data between specific dates.
a. Select the Start date and End date.
b. Click APPLY to filter and view the data between specific dates.
Then, the robot status and trend is displayed accordingly.
Related Topics