Application Server Performance
Application Server Performance Dashboard provides the system metrics performance data of all the application servers such as:
· Web servers wherein admin, workflow service and vanguard are installed
· Application servers wherein messaging, txnstore, logstash, kibana are installed. This dashboard shows the data for all the application servers.
On the APM Dashboard > click APPLICATION SERVER PERFORMANCE tab to view the application server performance details.
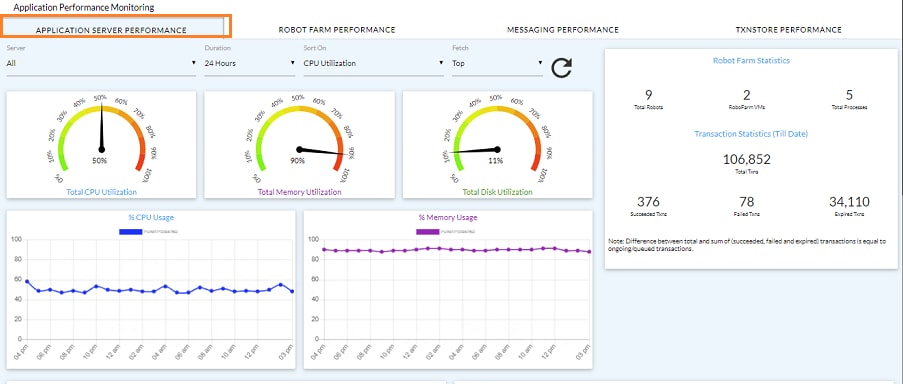
Application performance dashboard comprises of different views such as Total CPU Utilization, Total Memory Utilization, Robot Farm Statistics and so on. Additionally, you can filter the data as per selected criteria.
Charts
NOTE: |
These charts displays the average usage of all the servers, by default. From the Server list, you can select a specific server to view the corresponding data. For more information about server filtration, see filtration criteria. |
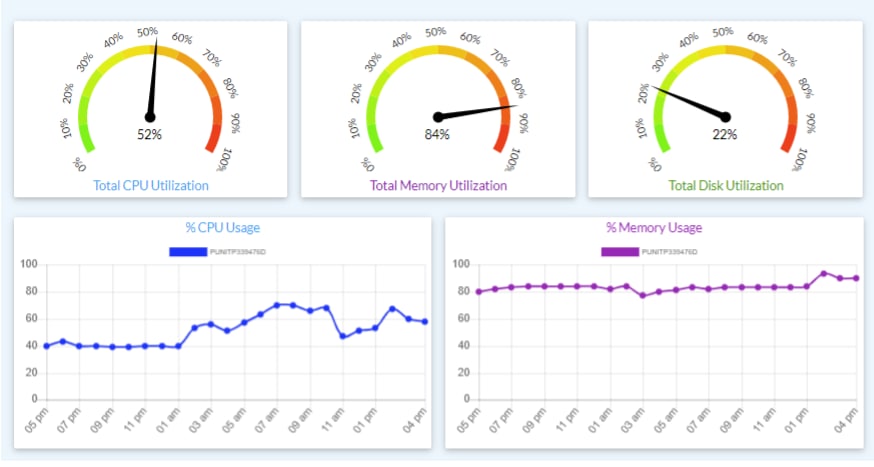
· Total CPU Utilization:
Total CPU Utilization chart displays the total average CPU utilization of all the servers. If a specific server is selected, it displays the data only for that server. The CPU usage data is displayed in percentage, based on different filters applied.
· Total Memory Utilization:
Total Memory Utilization chart displays the total average memory utilization of all servers. If a specific server is selected, it displays the data only for that server. The memory usage data is displayed in percentage, based on different filters applied.
· Total Disk Utilization:
Total Disk Utilization chart displays the total average disk utilization of all severs. If specific server is selected, then it displays data only for that server. The disk usage data is displayed in percentage, based on different filters applied.
· % CPU Usage:
% CPU Usage chart displays the CPU usage in percentage. It displays data based on selection of all servers or a specific server.
· % Memory Usage:
% Memory Usage chart displays the memory usage in percentage. It displays data based on selection of all servers or a specific server.
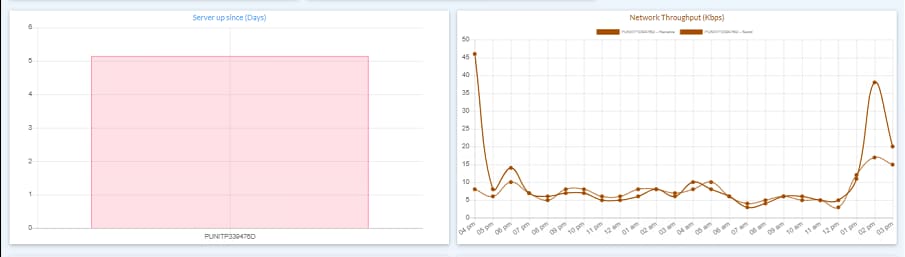
· Server up since (Days):
Server up since (Days) chart displays the server uptime duration since the server started. It is a measure of server reliability, expressed in day(s), hour(s) and minute(s). It displays data based on selection of all servers or a specific server. If any of the sever is down or disconnected for more than 5 minutes, then its data will not be displayed.
· Network Throughput (Kbps):
Network Throughput chart displays the send and receive activity of connected network in terms of Kbps. It displays data based on selection of all servers or a specific server.
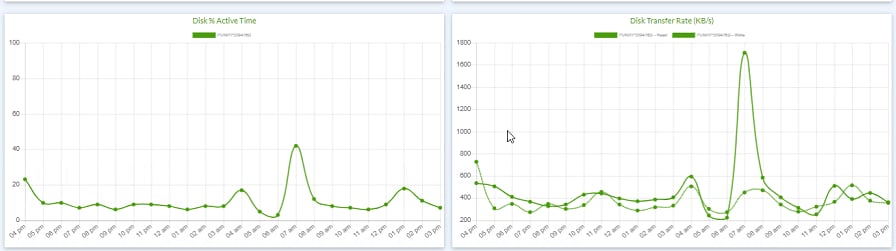
· Disk % Active Time:
Disk % Active Time chart displays the time (in percentage) the disk is processing either read or write requests. It displays data based on selection of all servers or a specific server.
· Disk Transfer Rate (KB/s):
Disk Transfer Rate (KB/s) chart displays the disk read or write activity in term of KB/s. If all severs are selected, then it displays the severs data that fits into filter criteria. If specific server is selected, then it displays the data only for that server.
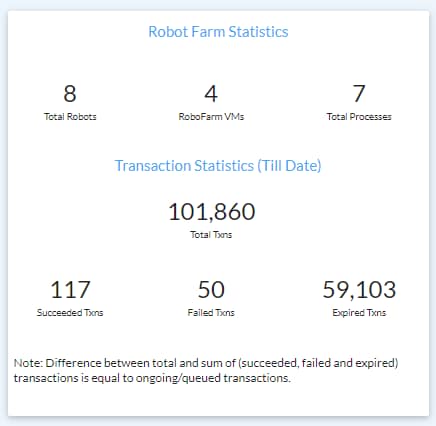
Robot Farm Statistics
Robot Farm Statistics displays the robot processing related statistics (explained below) across all the configured agents and robots.
Robot Farm Statistics
Robot Farm Statistics displays the current statistics of the system, such as:
· Total Robots: Displays the total number of robots deployed.
· Total VMs: Displays the total number of machines used in robot farms.
· Total Processes: Displays the total number of different processes configured across all robots.
Transaction Statistics (Till Date)
Transaction Statistics (Till Date) displays the statistics of the system from the time it has been setup. The following information is available:
· Total Txns: Displays the total number of transactions received or processed by all robots.
· Succeeded Txns: Displays the total number of successful transactions processed by all robots.
· Failed Txns: Displays the total number of failed transactions.
· Expired Txns: Displays the transactions that have expired before reaching to any robot.
NOTE: |
· The ongoing or queued transactions is calculated as difference between total and sum of (succeeded, failed and expired) transactions. Total Txns – (Succeeded Txns + Failed Txns + Expired Txns ). · Any filtration criteria is not applicable for this view. The data in this view is always shown irrespective of different filtration criteria selected. |
Filtration Criteria
Dashboard data can be viewed by selecting different filtration criteria such as Servers with high CPU usage, Servers with low memory usage and so on.

To filter the data:
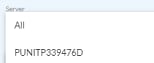
1. From the Server list, select the name of server.
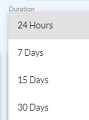
2. From the Duration list, select the duration for which you want to view the data.
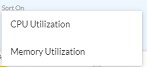
3. From the Sort On list, select the option according to which you want to sort the data.
4. From the Fetch list, select the fetch option to view the data accordingly.
5. Click
the  (Refresh)
icon to view the results as per the selected criteria.
(Refresh)
icon to view the results as per the selected criteria.
Following is the different combination of filtration criteria available:
Name of Filter |
Description |
Server
|
Displays the lists of all the servers for which system metrics is configured. · Robot Farm Performance: Displays the list of all the robot farm servers. · Application Server Performance: Displays the list all the application servers (web servers and application servers). · All: Displays data of the servers based on other filter criteria. § For Application Server Performance:If All is selected, it displays data for all servers § For Robot Farm Performance: If All is selected, it displays the data for at most five servers, based on other filter criteria. If a particular server is not listed/displayed on dashboard charts in ‘most five servers’ for the given filter criteria, user can select that particular server from drop-down to view the corresponding data. |
Duration
|
Displays the aggregate data based on duration selected. There are following values available for duration. · 24 Hours: Displays the data for last 24 hours. · 7 Days: Displays the data for last 7 days. · 15 Days: Displays the data for last 15 days. · 30 Days: Displays the data for last 30 days. |
Sort On
|
Enables you to sort data aggregation on selected value. Following values available to sort data. · CPU Utilization: Allows you to sort data as per the CPU utilization. · Memory Utilization: Allows you to sort data as per the Memory utilization. |
Fetch
|
· Top: Displays the top five servers data based on Sort On selected. For example, if you have selected Sort On as <CPU Utilization> and Fetch as <Top> then, top five servers data will be displayed based on the CPU Utilization. · Bottom: Displays the bottom five Servers data based on Sort On selected. |
NOTE: |
These filtration criteria will not be applicable to Robot Farm Statistics view. This view’s data will always be shown irrespective of different filtration criteria selected. |
On This Page Hide
Related Topics