TxnStore Performance
Txnstore Performance enables
you to view the performance statistics for the service operation
that flows through TxnStore. 
On the APM Dashboard > click TXNSTORE PERFORMANCE tab to view the performance statistics.
TxnStore Performace dashboard provides the following information:
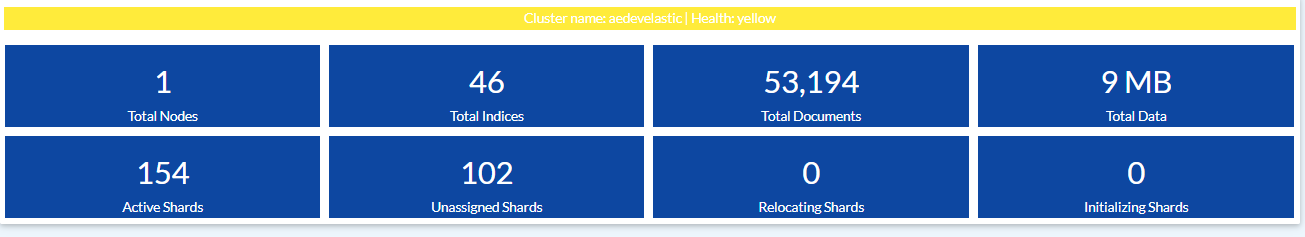
Cluster details
A cluster is made up of one or more nodes. Cluster details displays the details such as total nodes, total indices, total documents and so on.
Following field description table contains information about cluster details:
Cluster Details |
Description |
Cluster Name |
Indicates the name of the TxnStore cluster. |
Health |
Indicates the health of the cluster, status can be one of the following: · Green Status: Indicates that the cluster is in healthy (No issues with cluster) state. · Yellow Status: Indicates that the cluster is in some trouble and it is required to get the cluster back into healthy state. · Red Status: Indicates that the cluster is in danger zone and due to which elasticsearch might not work. |
Total Nodes |
Displays the total number of nodes (machines) where TxnStore is installed. |
Total Indices |
Displays the total number of indexes created (Indices are like to databases in RDMS term). This is useful while performing diagnostic to keep TxnStore structure healthy. |
Total Documents |
Displays the total number of documents (records) that are created. |
Total Data |
Displays the total size of data that is created in TxnStore. |
Active Shards |
Displays the total number of active shards. Shards are logical separation of data (shards like tables in terms of RDBMS) |
Unassigned Shards |
Displays the total un-assigned shards. If some of the nodes (machines) are unreachable in cluster, data (shards) of those machines become unreachable and shards remains in un-assign state. |
Relocating Shards |
As TxnStore moves, copies, or replicates the data internally between nodes, this field represents the relocated data. |
Initializing Shards |
Indicates that the data is loading. |
TxnStore System Details

Following field description table contains information about TxnStore System details:
TxnStore System details |
Description |
Uptime |
Displays the up and running time of cluster. |
TxnStore Memory |
Displays the total available and used memory by TxnStore. |
System Memory |
Displays the total available and used system memory of all TxnStore cluster nodes. |
System Disk |
Displays the total system disk space available for TxnStore nodes to store the data. |
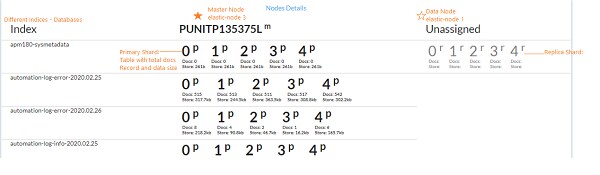
Nodes Details
Whenever you are starting the TxnStore instance, you are actually starting the nodes. The Nodes details provides information about the nodes in which the data resides. Additionally, it displays information about the node whether it is available or unassigned.
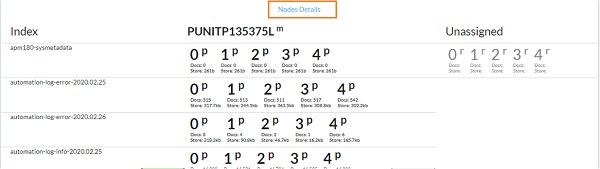
Following field description table contains information about nodes:
Nodes details |
Description |
Index |
Indicates the databases of TxnStore. |
m |
Indicates the master node and it will be in bold font. |
d |
Indicates the data node. |
Other columns specifics different nodes |
|
On This Page Hide