Messaging Performance Statistics
Messaging Performance Statistics enables you to view the performance
statistics for the service operation that flows through RabbitMQ.  Messaging
(RabbitMQ) is a message broker
which accepts and forwards the messages to components.
Messaging
(RabbitMQ) is a message broker
which accepts and forwards the messages to components.
On the APM Dashboard > click MESSAGING PERFORMANCE
Messaging Performance Statistics dashboard provides following information:
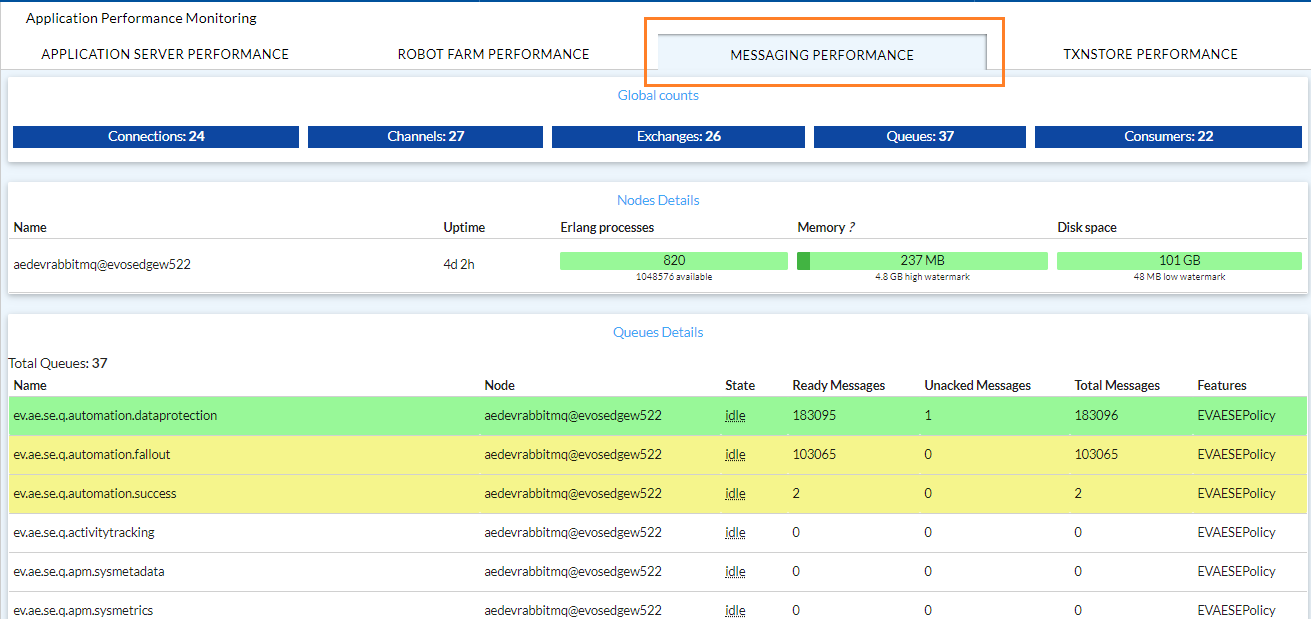
Global Counts
Global Counts displays the details of RabbitMQ Servers connection. This section displays the data related to connections, channels, exchanges and so on.

Following is field description of the global counts details:
Global Counts details |
Description |
Connections |
Displays the total number of connections to rabbitmq servers. Usually product components such as control tower, logstash, agents and robots connects to the rabbitmq server. By default around 10 connections are present. Other connections are established based on number of agents and robot deployed. Additionally, if any customization is done then, count may increase according to number of connections with rabbitmq. |
Channels |
Channel is usually created to publish (to send data) or subscribe (to receive data) from rabbitmq server. |
Exchanges |
Exchanges routes messages (automation requests, various commands from control tower and so on.) based on arguments containing headers and optional values. |
Queues |
Stores messages that are used by the applications. |
Consumers |
Various applications/components that are connected to send/receive data from rabbitmq server. |
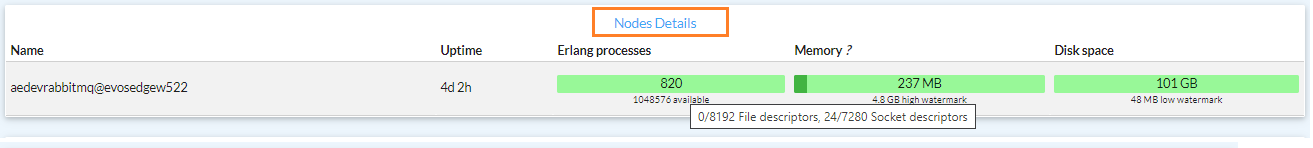
Nodes Details
Nodes details displays the rabbbitmq server cluster statistics.
Following is field description of the nodes:
Nodes details |
Description |
Name |
Displays the name of node in the cluster. |
Uptime |
Displays the duration for which the node is up and running. |
Erlang processes |
RabbitMq runs on top of Erlang run-time. Erlang processes enables you to understand the required capacity in a network to provision correctly. Displays the number of erlanng processes opened by rabbitmq server. On hovering a mouse over erlanng, you can view following information: · File descriptors: It shows the number of file descriptor used by rabbitmq server. · Socket descriptors: It shows the number of sockets open by rabbitmq server. |
Memory |
Displays the memory used by rabbitmq server. |
Disk space |
Displays the total disk space available on the server where rabbitmq is installed. |
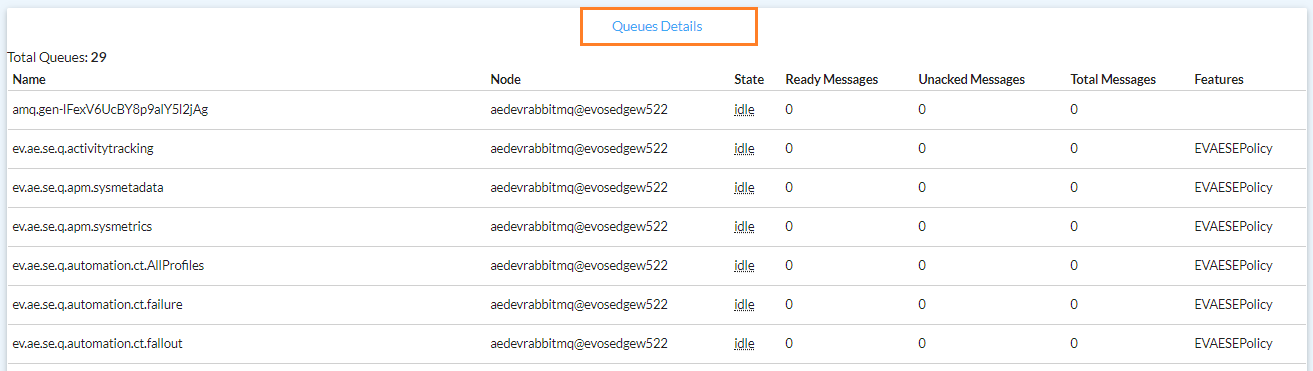
Queues Details
Queues details displays the total different number of queues created or being used in product. Additionally, displays the total queues count at the top.
Following field description table contains information about queues:
Queues details |
Description |
Name |
Displays the name of the queue. |
State |
Displays the state of queue, which can be either, · Running: Indicates that the consumers or publishers are connected to queue and messages are being processed from this queue. · Idle: Indicates that there is no message processing happening at that particular time. |
Ready Messages |
Displays the number of messages that are present in queues and ready for consumer (ideally robots) to use and act upon. |
Unacked Messages |
Displays the number of message that are in Unacknowledged state. Unacknowledged means messages are used by consumer (ideally agents or robots) but acknowledgement of the message processing is not yet received. |
Total Messages |
Displays the total number of message in ready and un-ack state. |
Features |
Displays the different features of queues such as policies if applied. |
On This Page Hide
Related Topics