Robot Farm Performance
Robot Farm Performance Dashboard view provides performance details of robot farm which includes:
· All Agents
· Robots Servers
By default, when you open APM dashboard, Robot Farm Performance dashboard is displayed.
On the APM Dashboard > click ROBOT FARM PERFORMANCE tab to view the robot farm performance details.
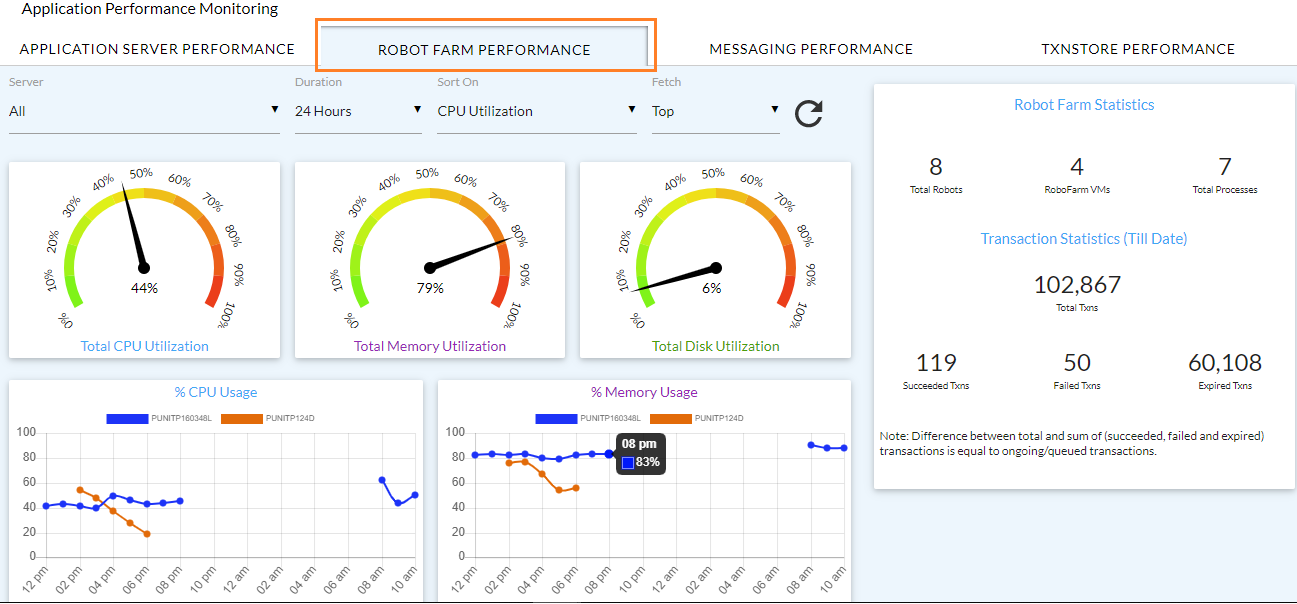
Robot Farm Performance dashboard comprises of different views which displays different system statistics and also helps you to filter the data. This dashboard view shows the same chart views a explained in the Application Server Performance Dashboard section with the following differences:
· Robot Farm Performance dashboard shows data for all robot farm servers unlike application server performance dashboard which shows data for all application servers.
· Robot Farm shows data for maximum 5 servers.
NOTE: |
By default, these charts display average usage of maximum five servers with highest CPU usage. Select filters to see data for different severs. To see data of individual server, select the required server from the Server drop-down list. |
For more information about Robot Farm Performance Dashboard, see Application_Server_Performance
Filtration Criteria
For more information about filtering the data, see Filtration Criteria.
On This Page Hide
Related Topics