ROI Dashboard
This section helps you to understand the process using which ROI can be calculated upon the RPA deployment.
You can perform the following in AssistEdge Analytics ROI
Prerequisites for accessing ROI Dashboard
Ensure that you have access to the user. For more information about ROI role access, see Role Access section.
Achieved ROI Insights
Dashboard provides detailed insights into the automation program. Each graph and table in the dashboard provide a quick insight into the ROI data. Dashboard information appears as per the current financial year (YTD).
Dashboard Automation insights data is visible one day after the Automation Processes are executed and General Configurations are saved. In case, you don't have access to the General configuration page, then contact your system administrator
You can view the dashboard insights as per the role and access provided to the logged-in user. By default, only three users can access ROI Dashboard which includes,
- Super Admin
- Business Analyst
- Business Leader
For more information about Analytics roles and access, see Role Access section.
Dashboard enables you to do the following:
- To view the dashboard in Graph view and Tabular view format.
- To view and filter insights of the analyzed task.
- Provides actionable insights to the data, so that you can quickly drill down to the preferred task.
To view the dashboard:
On the ROI analytics page, click ROI Dashboard > Achieved.
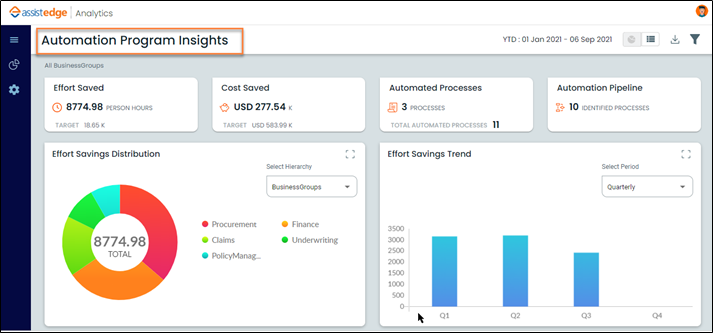
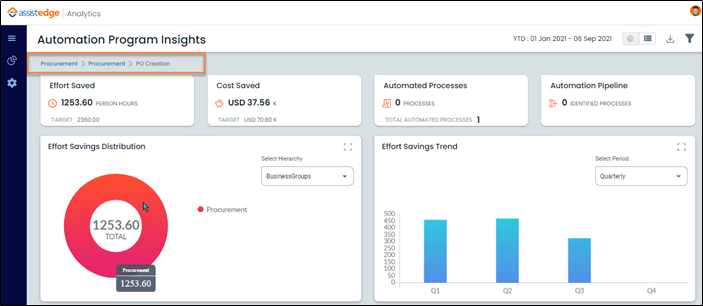
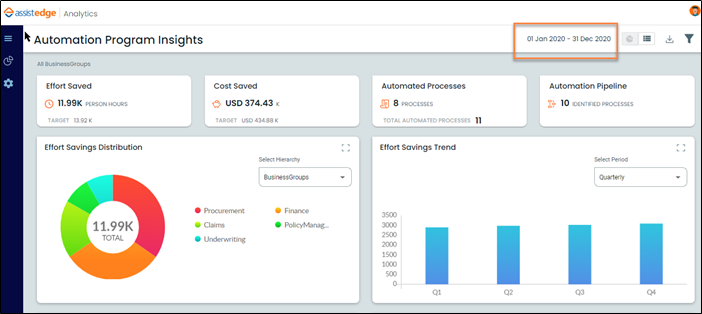
The Automation Program Insights page is displayed. The data on the ROI Achieved appears one day after the execution of the process. By default, a graph view of ROI Automation Program Insights appears.
Dashboard data gets updated on D-1 basis. It shows the following automation program insights as per the hierarchy level mapped:
- Effort Saved
- Cost Saved
- Automated Processes
- Automation Pipeline
- Efforts Savings Distribution
- Efforts Savings Trend
- Cost Savings Distribution
- Cost Savings Trend
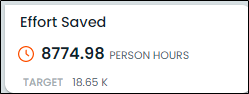
Effort Saved
Efforts Saved is based on automation executions and manual inputs defined in process configurations. It also shows the Target based on the manual input in target configuration.
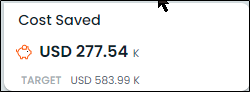
Cost Saved
Cost Saved is based on automation executions and manual inputs defined in process configurations. It also shows the Target based on the manual input in target configuration in USD.
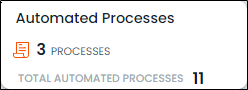
Automated Processes
Automated process section shows the number of executed processes for the selected time filter with the number of total automated processes.
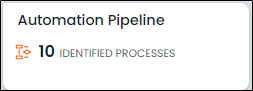
Automation Pipeline
Automation Pipeline section shows the count of processes in Automation pipeline as of D-1. In case you apply filter to automation pipeline then, the count displays the total processes in Pipeline as of end of the year selected.
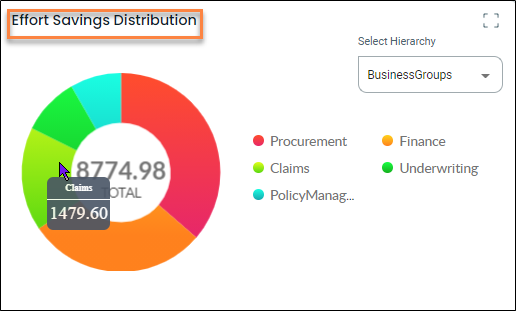
Efforts Savings Distribution
Efforts Savings Distribution provides the total hierarchy used in the task with its contribution of total efforts savings.
Efforts Savings Distribution: Graphical View
You can view the efforts savings distribution graph as per the hierarchy. By default, Organization level Efforts savings distribution pie chart is displayed. On hover the values of list are visible.
Following table explains the options available in the effort savings distribution insights:
| Name | Description |
| Select Hierarchy | Click the Select Hierarchy to view the insights of effort savings distribution at the different levels such as:
|
 |
Click  the icon to view the insights in full screen. the icon to view the insights in full screen. |
Efforts Savings Distribution: Table View
Click the  (Table) icon to view the efforts savings distribution in tabular format.
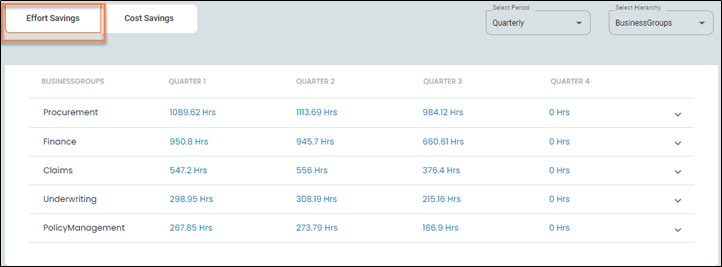
Following table explains the fields in the effort savings:
| Name | Description |
| Organization | Displays the name of the organization |
 |
Expands the effort savings details of the particular quarter |
| Select Period | Click the Select Period to view the insights of effort savings distribution as per:
|
| Select Hierarchy | Click the Select Hierarchy to view the insights of effort savings distribution at the different levels such as:
|
 |
Click the icon to view the insights in full screen. |
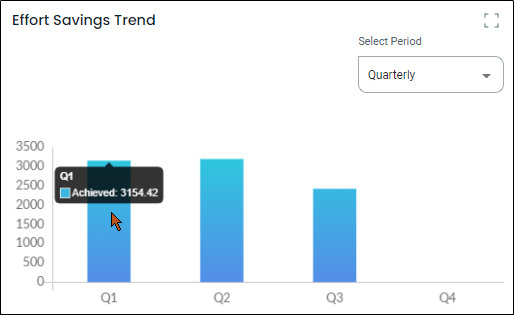
Efforts Savings Trend
Efforts Savings trend displays the period wise savings trend. Hover the mouse over the trend to view efforts savings.
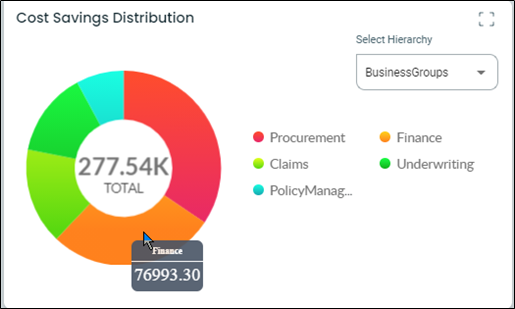
Cost Savings Distribution
Cost Savings Distribution displays the cost savings distribution. You can view the following:
Cost Savings Distribution: Graphical View
You can view the cost savings distribution graph as per the hierarchy. By default, <Business group> level cost savings distribution pie chart is displayed. Hover the mouse over pie chart to view the cost savings distribution.
Following table explains the options available in the effort savings distribution insights:
| Name | Description |
| Select Hierarchy | Click the Select Hierarchy to view the insights of cost savings distribution at the different levels such as:
|
 |
Click the icon to view the insights in full screen. |
Cost Savings Distribution: Table View
Cost Saving Distribution enables you to view the cost savings distribution for the organization on a quarterly basis or monthly basis. Click the ![]() (Table) icon to view the cost savings distribution in tabular format.
(Table) icon to view the cost savings distribution in tabular format.
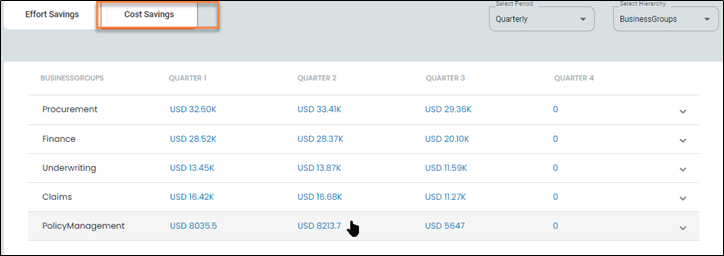
Following table explains the fields in the cost savings distribution:
| Name | Description |
| Organization | Displays the name of the organization |
| Quarter | Displays the number of cost-saving hours in the quarter from quarter 1 to quarter 4 |
 |
Expands the cost-saving details of the particular quarter |
| Select Period | Click the Select Period to view the insights of cost-saving distribution as per:
|
| Select Hierarchy |
Click the Select Hierarchy to view the insights of cost savings distribution at the different levels such as:
|
 |
Click the icon to view the insights in full screen. |
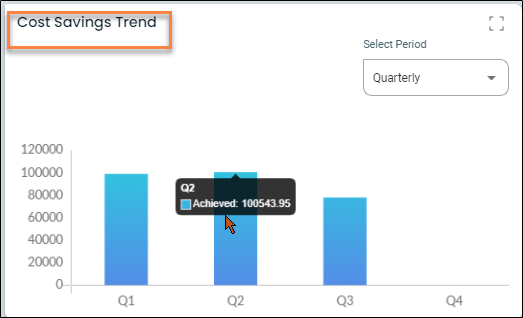
Cost Savings Trend
Cost Savings Trend displays the cost savings trend. Hover the mouse over the trend to view the achieved cost savings.
Other Actions
You can perform the following actions on the Automation Insights page:
Graphic and Table View
To view the dashboard in Graphical and Tabular format. Click the  (Graph View) icon to view the graphical view of Automation Program Insights or click the
  (Table view) icon to view the tabular format of Automation Program Insights.
Download
Enables you to download the automation program insights in PDF and Excel format. Click the  (Download) icon to download the automation insights.
- You can download the Graphic view automation program insights in PDF format
- You can download the Table view automation program insights in Excel format
Preferences
Preferences option is available only for the Automation Program Insights page. This option enables you to set the preference for the automation program insights at the organization level. For more information about the business hierarchy set, see Before proceeding – Business Hierarchy (Example).
|
NOTE: |
|

This page contains three tabs which include:
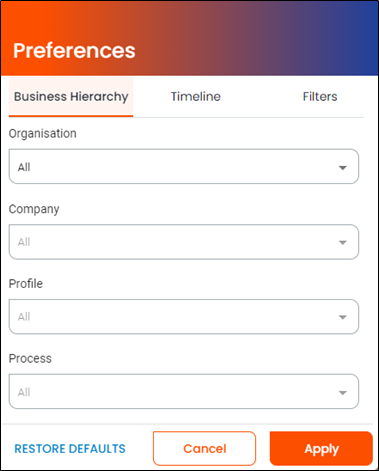
Business Hierarchy
To set Business Hierarchy preferences:
- Click the
 icon on the top bar.

The Preferences page appears.
- Click the Business Hierarchy tab to set the hierarchy for the business.
- In the < Hierarchy> list, select the preferred option. Hierarchy appears as per the configured values in the Admin Module. For more information, see Before proceeding – Business Hierarchy (Example).
- In the Profile list, select the name of the profile.
- In the Process list, select the name of the process.
- Click Apply to set the business hierarchy.
The Automation Program Insights appears as per the set preference.
OR
Click RESTORE DEFAULT to restore the previous changes or retain default changes.
Timeline
To set timeline preferences:
- Click the
 icon on the top bar.

The Preferences page appears.
- Click the Timeline tab to set the timeline for the Automation Program Insights.

The Preferences > Timeline tab is displayed.
- In the YEAR list, select the preferred year for which you want to view the Automation Program Insights.
- Click Apply.
The Automation Program Insights appears as per the set timeline.
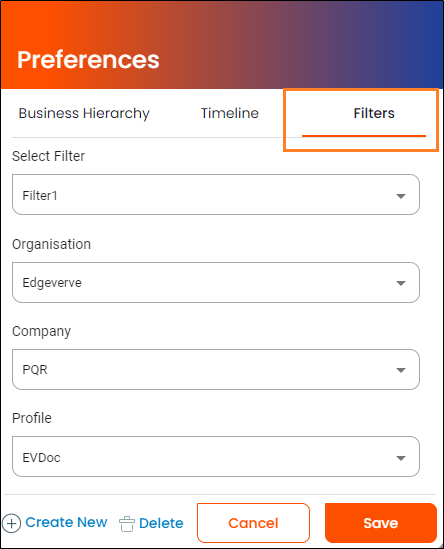
Filters
If you have set any filters then those particular options are shown while applying the filters. The set filter will be shown on the top bar > My Filter.
Filters tab enables you to perform the following:
- Enables you to create a new filter
- Enables you to delete the existing filter if any.
To set a new filter:
- Click the
 icon on the top bar.
The Preferences page appears.
- Click the Filters tab to set a filter for the Automation Program Insights.
- Click the
 icon.
icon.
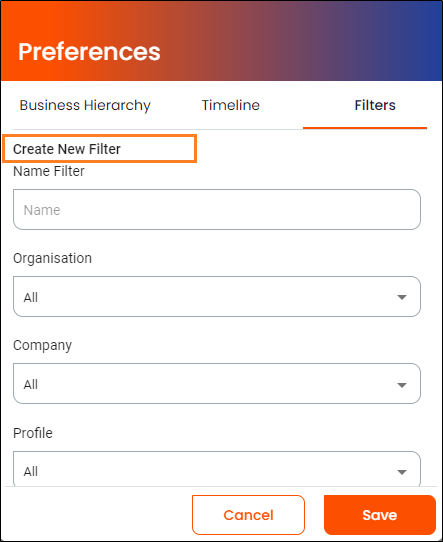
The Create New Filter window is displayed.
- In the Name Filter, specify a name for the filter.
- In the <Business Hierarchy> list, select the preferred option. For more information, see Before proceeding – Business Hierarchy (Example).
- In the Profile list, select the preferred profile from the available list of options.
- In the Process list, select the preferred process from the available list of processes.
- In the Year list, select the years for which you want to apply the filter.
- Click Save.
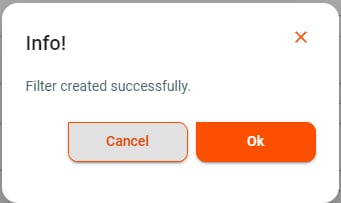
A message appears as Filter created successfully.
- Click Ok.
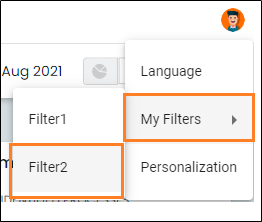
A newly added filter appears in My Filters.
User Settings
Allows you to set the user settings for automation program insights such as Location, My Filters, and Personalization. For more information, see The User Interface.
Automation Pipeline Insights
Before starting with automating the process, you are required to identify the suitable processes. AE Discover accelerates and scales automation across the organization by recording the user tasks, enabling the business analyst to analyze the Automation blueprint, task map, and identifying automation opportunities with the major business impact, and then, automating the process in Automation Studio.
At first no data is shown when you log into Automation Pipeline. Data starts appearing only after performing the discover connection settings. For more information about performing Discover connection settings, see Discover Connection Settings section in Administrator.
In case, AssistEdge Discover is available, ensure that discover connection settings are done to get the data populated on the Automation Pipeline page.
|
NOTE: |
For detailed estimated ROI insights and automation prioritization matrix, it is recommended to have the AssistEdge Discover setting done. If Discover Connection Settings are not performed then, automation pipeline summary insights will not be available however, clients can continue defining the pipeline manually. |
Prerequisites
Ensure that you have access to the user. For more information about Analytics roles and access, see Role Access section.
Starting with Automation Pipeline
ROI is calculated in terms of the total automation savings. AE Discover User Groups are equivalent to Profile Name in AE RPA. For the first time when data is fetched from discover, and if the name of profile and user group differs then, the profile appears as unmapped. You can map the profile to your preferred profile in the Analytics. For more information about mapping the profile, see Editing a profile.
ROI Pipeline covers the following aspects:
- Automation Pipeline – Number of the Identified process
- Estimated effort savings distribution in person-hours
- Estimated cost savings distribution in USD
Pipeline enables you to access and view the following:
- To view and filter the pipeline insights related to estimated effort savings distribution in person-hours and estimated cost savings distribution in USD.
- Provides actionable insights to the data, so that you can quickly drill down to automation tasks.
Automation Pipeline provides two views of data:
- Pipeline -Graph View
- Pipeline -Table View
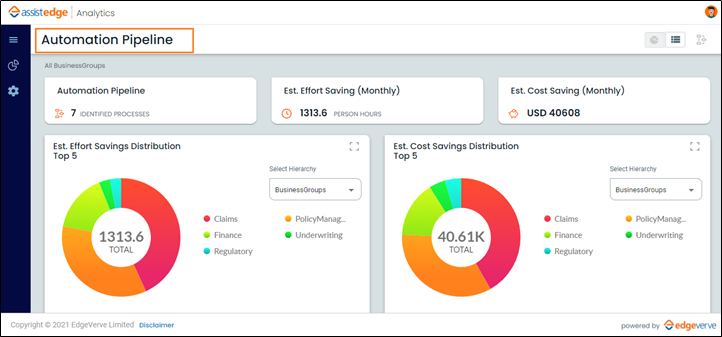
Automation Pipeline -Graph View
Automation Pipeline Graph provides detailed insights into identified automation process.
|
NOTE: |
By default, Graph view is available only if you have configured the AssistEdge Discover. |
Following information appears in the pipeline:
- Automation Pipeline
- Est.Effort Saving (Monthly)
- Est. Cost Saving (Monthly)
- Est. Cost Savings Distribution
- Est. Efforts Savings Distribution
- Automation Prioritization Matrix
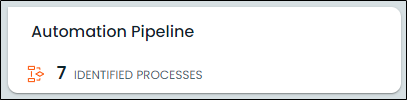
Automation Pipeline
Automation Pipeline section shows the current count of processes identified for automation.
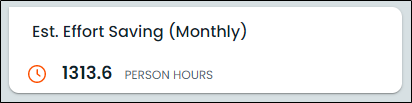
Est.Effort Saving (Monthly)
ROI Automation Pipeline shows the monthly estimated effort savings monthly.
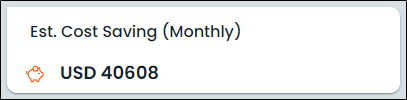
Est. Cost Saving (Monthly)
ROI Automation pipeline shows the monthly estimated cost savings in USD.
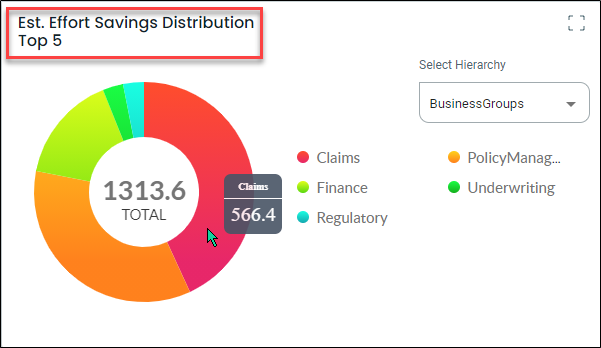
Est. Effort Savings Distribution
Est Effort Savings Distribution (Monthly) displays the top 5 effort savings hours as per the selected hierarchy with its total monthly hours spent on the particular task.
You can view the graph as per your preference. In the Select Hierarchy list, select the preferred option from the available options:
- Configured Business Hierarchies are listed i.e., Business Group > Department > Sub-Department
- Profile
- Process
Hover the mouse over pie chart to view the percentage of est. effort savings distribution.
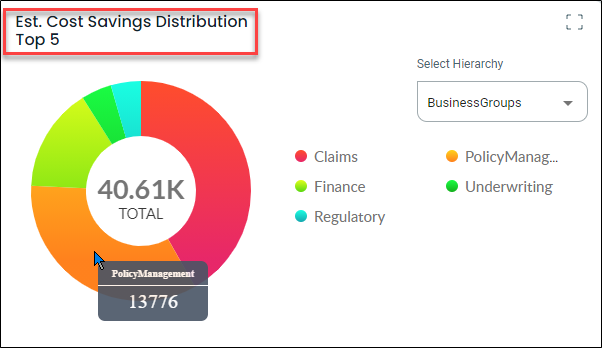
Est. Cost Savings (Monthly)
Est Cost Savings (Monthly) displays the top 5 cost savings hours as per the selected hierarchy with its total monthly hours spent on the particular task. You can view the graph as per your preference. In the Select Hierarchy list, select the preferred option from the available options:
- Configured Business Hierarchies are listed i.e., Business Group > Department > Sub-Department
- Profile
- Process
Hover the mouse over the pie chart to view the percentage of estimated cost savings for particular business group.
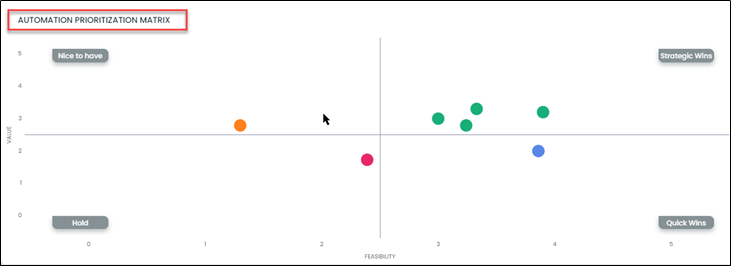
Automation Prioritization Matrix
Once the inputs are provided, Discover’s in-built frameworks create the Automation Prioritization Matrix AE Discover calculates and displays the Automation Score which includes technical and business scores.
Automation Prioritization Matrix is a quadrant that is plotted against two parameters – Value and Feasibility.
The value is a relative measure that can be garnered by automating a task and it lies on a scale between 1 to 5. Feasibility measures how easy it is to automate a task and is also measured on a scale of 1 to 5. This Matrix categorizes the analyzed tasks under 4 different categories based on their respective value and feasibility scores:
- Strategic Wins: High-value high feasibility
- Quick Wins: Low-value high feasibility
- Nice to Have: High-value low feasibility
- Hold: Low-value low feasibility
The Matrix allows users to view the task names and respective scores by hovering over the task circle.
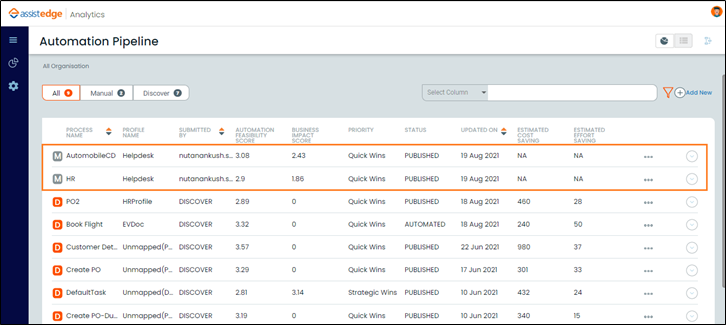
Automation Pipeline -Table View
Automation Pipeline Table View shows the manually identified task and task identified by AE Discover. AE Discover User Groups are equivalent to Profile Name in AE RPA. For the first time when data is fetched from discover, and if the name of profile and user group differs then, the profile appears as unmapped. You can map the profile to your preferred profile in the Analytics. For more information about mapping the profile, see Editing a profile.
This page contains three tabs which include:
- All: All Tab displays all the manually identified task by user as well as task identified from AE Discover. Also, it displays the number of tasks in Automation pipeline.
- Manual: Manual Tab displays only the task which is added manually. Also, it displays the number of tasks in manual pipelines created.
- Discover: Discover Tab displays the automation task which is fetched from the AE Discover. Also, it displays the number of tasks in automatically fetched automation pipelines.
Click the  (Table view) icon to view the tabular format of the Automation Pipeline.
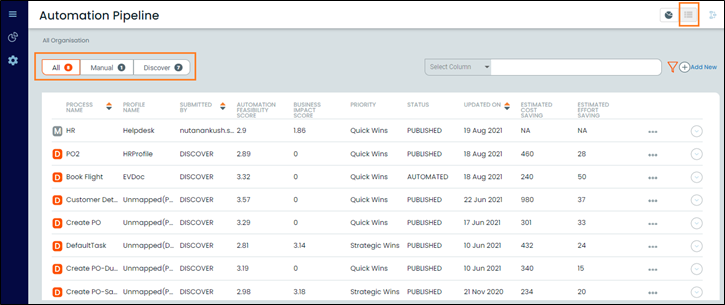
The Automation Pipeline page is displayed.
Following table explains the fields on the automation pipeline page:
| Name | Description |
| Process Name | Displays the name of the process |
| Profile Name | Displays the name of the profile. If any profile is not mapped to a particular process then, you edit the profile. |
| Submitted By | Displays the name of the user who identified and published the process in Automation Pipeline. In-case records are fetched from AE Discover then, submitted by shows as Discover. |
| Automation Feasibility Score | Displays the automation feasibility score to automate a task. Product calculates the score which rates the process in terms of feasibility in implementing the automation. It measures the feasibility on a scale of 1 to 5 and, 5 being indication of high automation feasibility. |
| Business Impact Score | Displays the business impact score. Product calculates the score which indicates the business value that can be generated on automation of the process. It measures the business impact score on a scale of 1 to 5 and, 5 bring indication of high business value. |
| Priority | Displays the priority of automation score such as Strategic wins, Quick Wins, Nice to have and hold. |
| Status | Displays the status of the automation process. For example, Published, Unpublished or Automated |
| Updated On | Displays the date on which the status of the process got updated. |
| Estimated Cost Saving | Displays the value of estimated cost savings. This field is applicable only when AE Discover is configured. |
| Estimated Effort Saving | Displays the value of estimated effort savings. This field is applicable only when AE Discover is configured. |
 |
Enables you to perform following actions for Discover and Manual Automation Pipeline:
|
 |
Click the  icon to expand and view the details updated to the process name. icon to expand and view the details updated to the process name. |
 |
icon corresponding to any process name indicates that the process is fetched directly from Discover. |
 |
Click the icon to filter the data as per your preference. Following are the filter options:
|
 icon to performing the following actions:
Viewing the details
Enables you to view the details of the user group by logging into the Discover Insights Hub.
To view the details:
- In the Automation Pipeline Table View, click the
 icon.
icon. - Select the View Details option.
The Discover Login page is displayed. - In the Email Address field, enter the email address.
- In the Password field, enter the password.
- Click Log in.
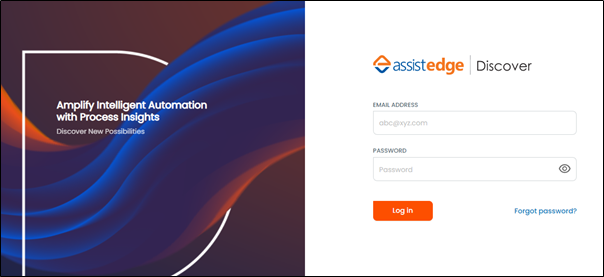
You can log in to Discover and view the details of the automation pipeline.
Mark as automate
Enables you to automate the manual profiles.
|
NOTE: |
Mark as Automate option appears only for Published processes. |
To mark the process as automate:
- In the Automation Pipeline Table View, click the
 icon.
icon. - Select the Mark as Automate option.
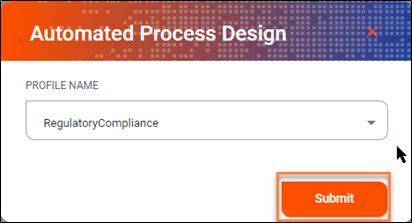
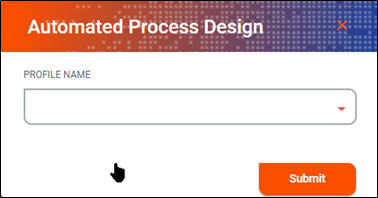
The Automated Process Design page is displayed.
- In the Process Name, select the name of the process.
- Click Submit.
A message appears as Process marked as Automated. The selected process is automated, and the status is also updated as Automated in the table view.
Editing a profile
Enables you to map the unmapped profile to your preferred profile.
To edit a profile:
- In the Automation Pipeline Table View, click the
 icon.
icon. - Select the Edit Profile option.
The Automated Process Design page is displayed.
- In the Process Name, select the name of the process.
- Click Submit.
A message appears as Discover Profile updated. The selected process is mapped to a particular process in the table view.
Adding new process to pipeline manually
If required, you can also add a new process to pipeline manually.
To add a new manual pipeline:
- On the Automation Pipeline Table View page > click the
 icon.
icon.
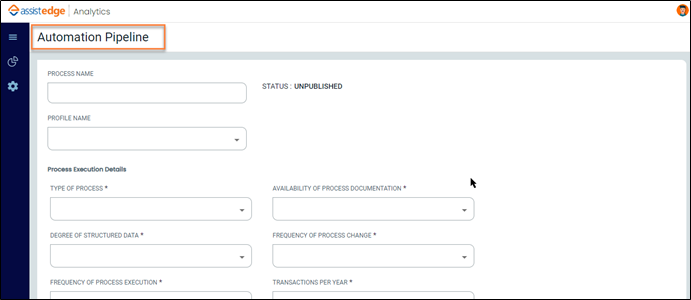
The Automation Pipeline page is displayed.
Following table explains the automation pipeline:
| Name | Description |
| Process Name | Specify the name of the process |
| Profile Name | Select the preferred process from the available options. |
| TYPE OF PROCESS | Select the preferred type of process from the available options such as Completely Judgment based, .Somewhat Judgement based, Somewhat rule-based, and so on. |
| AVAILABILITY OF PROCESS DOCUMENTATION | Select the preferred process documentation option |
| DEGREE OF STRUCTURED DATA | Select the preferred structure data list option from the available options:
|
| FREQUENCY OF PROCESS CHANGE |
Select the preferred process change frequency from the available options:
|
| FREQUENCY OF PROCESS EXECUTION |
Select the preferred process execution frequency from the available options:
|
| TRANSACTIONS PER YEAR | Select the preferred transactions for a particular year from the available options:
|
| SEASONAL VARIATIONS | Select Yes or No for the seasonal variations. |
| NUMBER OF APPLICATIONS |
Select the preferred number of applications from the available options:
|
| TYPE OF APPLICATIONS | Select the preferred application type from the available options which are used in the process:
|
| AVAILABILITY OF LOWER LEVEL ENVIRONMENTS FOR APPLICATIONS |
Select the available lower-level environment for the application from the available options:
|
| LEVEL OF TASK SECURITY AND ACCESS | Select the preferred task security and access from the available option:
|
| NUMBER OF SCREENS | Select the number of the preferred screen for which data needs to be captured from the available option:
|
| TOTAL NUMBER OF STEPS | Select the total number of steps for which data must be calculated from the available options:
|
| NUMBER OF REPEATING STEPS | Select the number of repeating steps from the available options:
|
| NUMBER OF COPY PASTE EVENTS |
Select the number of copy-paste events from the available options:
|
| PROCESS DURATION (MINUTES) | Select the minutes of process duration from the available options:
|
| TIME BETWEEN STEPS (SECONDS) | Select the time between the steps from the available options:
|
| NUMBER OF VARIATIONS TO THE PROCESS FLOW | Select the number of variation process flow from the available options:
|
| NUMBER OF FTES | Select the number of ftes from the available option:
|
| POTENTIAL TO REPURPOSE WORKFORCE | Select the preferred option from the available options:
|
| POTENTIAL TO IMPROVE TASK QUALITY | Select the preferred option from the available options:
|
| POTENTIAL TO IMPROVE RISK AND CONTROLS | Select the preferred option from the available options:
|
| CUSTOMER INTERACTION CHANNEL | Select the preferred checkbox from the options:
|
- Click Save.
A message appears as Process has been saved successfully.
- Click Publish to directly publish the manual pipeline.
The Manually added process will be shown under Manual Tab > Automation Pipeline.
A message appears as Process has been published successfully.
Additionally, you can perform the following actions:
- Unpublish: You can unpublish the manual pipeline. Click the
 icon > Unpublish.
 - Mark as Automate: You can mark the manual task as automate Click the
 icon > Mark as Automate.
Other Actions
You can perform the following actions on the Automation Pipeline page:
- You can view the dashboard in Graph or Tabular format. Click the
 (Graph View) icon to view the graphical view of Automation Pipeline or click the
  (Table view) icon to view the tabular format of Automation pipeline.
 - Enables you to set the preference for the automation program insights of the analyzed task as per Preferred Business Hierarchy, Timeline, and Filters. Click the
 (Preferences) icon to set the preference for the automation pipeline. Select the preferred business preferences and click Apply.
 - Allows you to set the user settings for automation program insights such as Location, My Filters, and Personalization.