Robot Performance Dashboard
Robot Performance dashboard tracks the performance of individual robots executing the incoming requests, validated as qualified for automation.
The dashboard consists of the following tabular and graphical reports:
· Robot Average Execution Time: Time Trend
· Robot Utilization (Percentage)
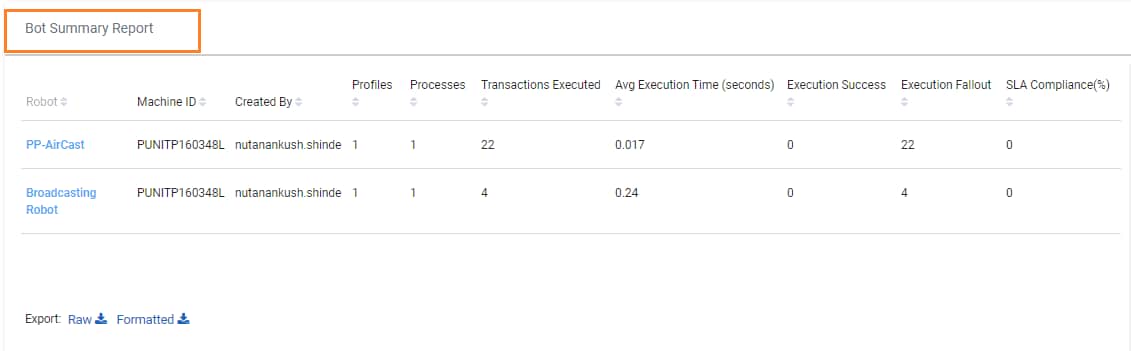
Bot Summary Report
 Bot Summary Report displays
the total number of transactional requests executed by individual
robots across the profile during a particular period along with
their efficiency.
Bot Summary Report displays
the total number of transactional requests executed by individual
robots across the profile during a particular period along with
their efficiency.
Following is a sample Bot Summary Report:
Following is the field description of Bot Summary Report:
Reports fields |
Description |
Robot |
Indicates the name of Robot which is executing the automation requests. |
Machine ID |
Indicates the Machine ID on which the robot is deployed. |
Created By |
Indicates the name of user who has created the Robot. |
Profiles |
Indicates the number of profile which are assigned to the robot. |
Processes |
Indicates the number of processes which are assigned to the robot. |
Transaction Executed |
Indicates the number of transactions for which the automation requests are executed. |
Avg Execution Time (Seconds) |
Indicates the average time a robot takes to execute a qualified request (Robot Execution End Time – Robot Execution Start Time). |
Execution Success |
Indicates the number of transactions which are successfully executed. |
Execution Fallout |
Indicates the number of transactions which are failed while execution. |
SLA Compliance(%) |
Indicates the percentage of SLA compliance (whether the execution of a particular transaction request in a process got completed successfully within the defined SLA time. The SLA time of any process can be defined at the time of deployment in Design Studio.) |
The report can also be downloaded, if required. For more information, see Downloading_Reports.
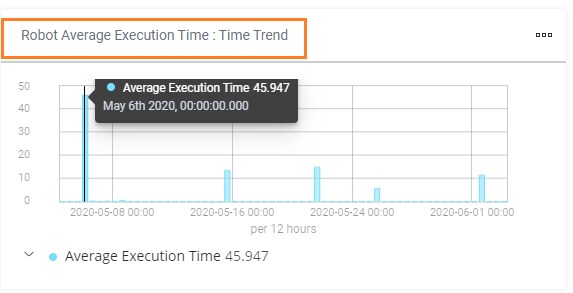
Robot Average Execution Time: Time Trend
Robot
Average
Execution Time: Time
Trend report tracks the
average execution time taken by each robot to execute the transaction
requests assigned to it during the chosen period.
Following is a sample Robot Average Execution Time: Time Trend report.
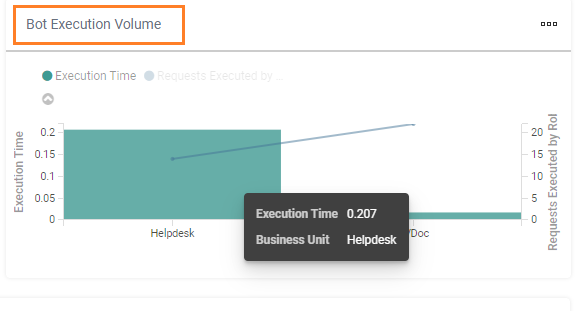
Bot Execution Volume
Bot Execution Volume report tracks the average handle time taken by the bots to execute automation requests of processes of individual profile. It displays how the digital workforce resource is utilized across the profile. Apply a filter on individual robots for detailed study of bot utilization across the profiles.
Following is a sample bot execution volume report:
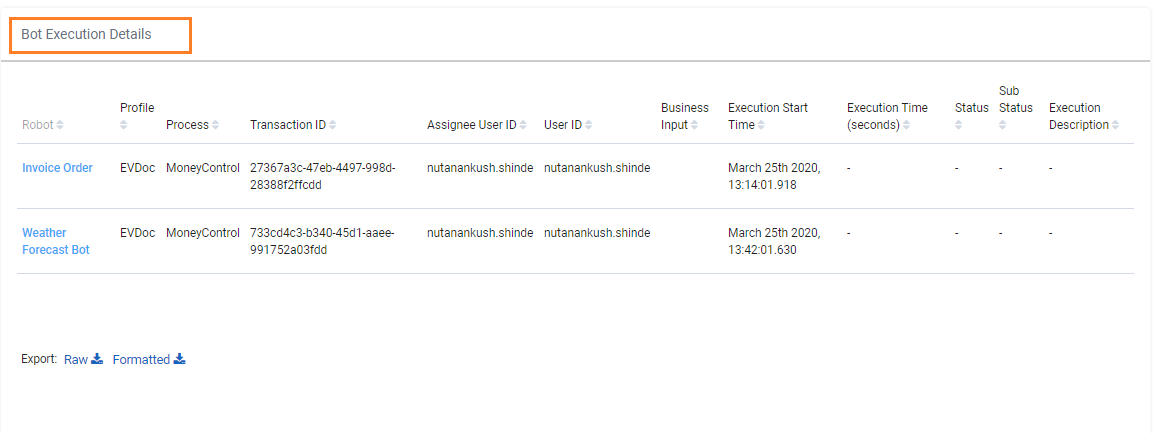
Bot Execution Detail
Bot Execution
Detail report provides the list of transactions and
corresponding details, that the bots have executed.
Following is a sample bot execution detail report:
Following table provides the bot execution details - field descriptions:
Reports fields |
Description |
Robot |
Indicates the name of Robot which is executing the automation requests. |
Profiles |
Indicates the name of the profile assigned to the Robot |
Processes |
Indicates the process name which is executed by the robot. |
Transaction ID |
Displays the transaction ID of the Automation Request. |
Assignee User ID |
Indicates the User ID to whom the robot has been assigned. |
User ID |
Displays the UserID used for authenticating the robot. |
Business Input |
Displays the Process Input for a particular transaction. |
Execution Start Time |
Indicates the start date and time from which the execution of transactions is started by the robot. |
Execution Time (seconds) |
Indicates the time a robot takes to execute a qualified request. (Robot Execution End Time – Robot Execution Start Time). |
Status |
Displays the status of the bot transactions such as success or failure. |
Sub Status |
Indicates whether the transaction is sent to Albie Decision Workbench. |
Execution Description |
Displays the description related to execution |
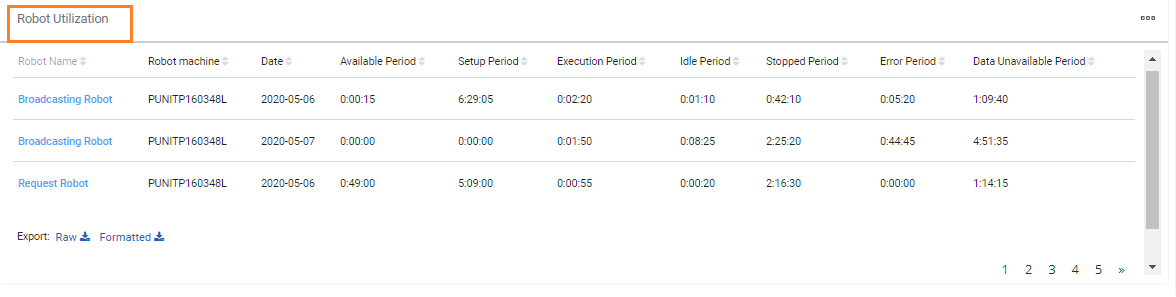
Robot Utilization
Robot Utilization report indicates the time period for which robot was there in different statuses. The report is structured to present the data on date basis.
NOTE: |
Ensure that the Vanguard component is up and running all the time. The robot unavailability data in the Robot Utilization Report is generated after every 15 minutes of duration. If the Vanguard component is down, then the data may not be available for certain period. |
Following is a sample robot utilization report:
Following table provides the bot utilization details - field descriptions:
Reports fields |
Description |
Robot Name |
Indicates the name of robot. |
Robot Machine |
Indicates the machine name on which the robots are deployed. |
Date |
Indicates the statuses of robot for particular date. |
Available Period |
Indicates the duration for which the robot was in available state. |
Setup Period |
Indicates the duration for which the robot was in setup state |
Execution Period |
Indicates the duration for which the robot was executing the process. |
Idle Period |
Indicates the duration for which the robot was idle state and not executing any request. |
Stopped Period |
Indicates the duration for which the robot was in stopped state. |
Error Period |
Indicates the duration for which the robot was in error state. |
Data Unavailable Period |
Indicates the duration for which the robot was in unavailable state. This unavailable status data is populated after every 15 minutes. The robot may move to unavailable state, if: · VM was down for maintenance · Robot agent is down or unresponsive. |
The report can also be downloaded, if required. For more information, see Downloading_Reports.
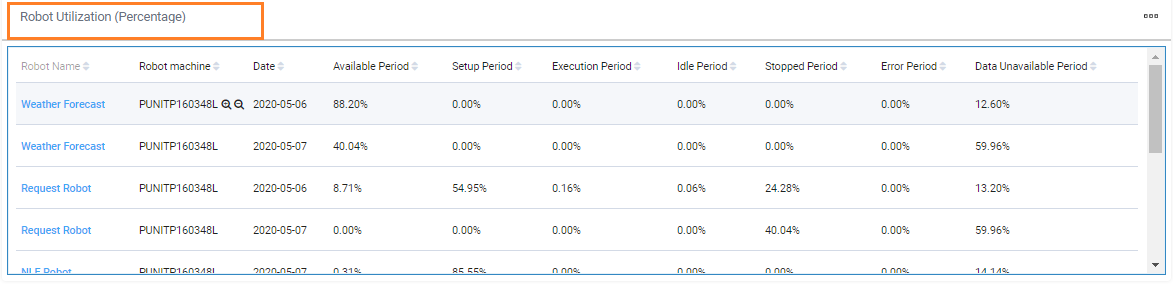
Robot Utilization (Percentage)
This report indicates the percentage time period for which robot was there in different statuses. The report is structured to present the data on date basis.
NOTE: |
Ensure that the Vanguard component is up and running all the time. The robot unavailability data in the Robot Utilization Report is generated after every 15 minutes of duration. If the Vanguard component is down, then the data may not be available for certain period. |
Following is a sample robot utilization (percentage) report:
Following table provides the bot utilization details - field descriptions:
Reports fields |
Description |
Robot Name |
Indicates the name of robot. |
Robot Machine |
Indicates the machine name on which the robots are deployed. |
Date |
Indicates the statuses of robot for particular date. |
Available Period |
Indicates the percentage duration for which the robot was in available state. |
Setup Period |
Indicates the percentage duration for which the robot was in setup state |
Execution Period |
Indicates the percentage duration for which the robot was executing the process. |
Idle Period |
Indicates the percentage duration for which the robot was idle state and not executing any request. |
Stopped Period |
Indicates the percentage duration for which the robot was in stopped state. |
Error Period |
Indicates the percentage duration for which the robot was in error state. |
Data Unavailable Period |
Indicates the percentage for which the robot was in unavailable state. This unavailable status data is populated after every 15 minutes. The robot may move to unavailable state, if: · VM was down for maintenance · Robot agent is down or unresponsive. |
On This Page Hide
Related Topics