Transaction Execution Dashboard
Transaction Execution Dashboard consists of Transaction Execution: Profile View report, Transaction Execution: Process View, Transaction Execution: Bot View, and so on. This dashboard covers following aspects regarding execution of an incoming request:
· Number of automatable requests executed by Robots and Number of requests expired before being picked up for execution.
· Time taken for the end to end execution of an automation request.
· The step-wise holistic view of a typical request being executed.
· Frequent reasons for execution fallouts, the process steps where requests are failing and the applications under which the transactions are failing.
This dashboard covers following aspects regarding execution of an incoming request:
· Transaction Handling Time: Total time taken for a transaction request to execute completely. It consists of three distinct components:
a. Validation Time: The time duration between when a request is received by the system and when it is validated as qualified or not qualified for automation. For more information about the reasons why a request may not qualify automation, see Transaction Validation Dashboard. The validation of a request takes place in the Listener component. This metric is calculated for all requests irrespective of whether or not they qualify for automation.
b. Wait Time: The time difference between the request received by the robot for execution and the time when robot actually starts executing the request. It is calculated for all incoming requests qualified for automation and waiting in the queue for execution.
c. Execution Time: The time taken by the robot to execute a request, which has been validated as qualified for automation (Robot Execution End Time – Robot Execution Start Time)
Transaction Handle Time = (Robot Execution End Time – Listener Start Time)
The equation Avg Transaction Handle Time = SUM (Avg Validation Time, Avg Wait Time, Avg Execution Time) may not hold true always, because Validation Time considers all the incoming requests for calculation, while Wait Time and Execution Time consider only those requests which are validated as qualified for automation. All these values are measured in seconds.
· Execution Success and Execution Failure: Execution Success Ratio is defined as the ratio between the (number of requests which were executed completely with success status) to the (number of transaction requests validated as qualified for automation). Robots maybe unable to completely execute every request validated as qualified for automation due to the following reasons (not limited to):
a. Business Validation Failure: Business validation is done at listener first and then at the robot’s end. The following types of error messages can appear for the given scenario:
i. Profile Name is Missing: Missing/Incorrect mandatory field in the request.: Field Name: ProfileName
ii. Profile Name is Incorrect: Incorrect profile name in the request.
iii. User Name is Missing: Missing/Incorrect mandatory field in the request.: Field Name: UserName
iv. Input Parameter:
o Count mismatch: Incorrect automation input parameter count mismatch.
o Incorrect Parameter name: Incorrect automation input parameter name provided.
b. Application Failure or Application Slowdown: At present, there is no segregation between a request not executed completely and failed because of an application downtime or a request failed because of wrong treatment (wrong or changed control ID, etc.) of a perfectly working application.
In either of the above cases, the outcome is either Search Timeout or Search Failed. There are reports available to find out the application used at a particular step where the request failed during execution.
Applications failing to launch at the time of sign-in, gets tracked. In such cases, execution of a request is not triggered by the robot. An application level timeout duration is not available.
c. Search Timeout: This message appears when automation requests breach the request expiry duration.
§ Search Failed: A Search Failed message may appear due to the following reasons:
o Search timeout
o Invalid data
o Wrong configuration (Control not found)
o Incomplete or wrong data feed provided to applications in further steps and so on.
§ SLA Adherence: This metric validates whether a particular automation request was completed and successfully executed within the defined SLA timeline. The process SLA can be defined at the time of deploying a process in the Automation Studio.
Following reports are covered in this dashboard, such as:
· Transaction Execution: Profile View
· Transaction Execution: Process View
· Transaction Execution: Bot View
· Transaction Execution Report
· Transaction Execution Report: Step Details
· Transaction Execution Success: Time Trend
· Transaction Average Handle Time: Time Trend
· Transaction Execution Fallout Reasons
· Transaction Execution Fallout Reasons: Time Trend
· Application Failures: Time Trend
· Application Performance Time Trend
Transaction Execution: Profile View
Transaction Execution: Profile View report provides a tabular representation for the profile-wise execution status of incoming requests, validated as qualified for automation and so on.
Following is a sample transaction execution: profile view report:
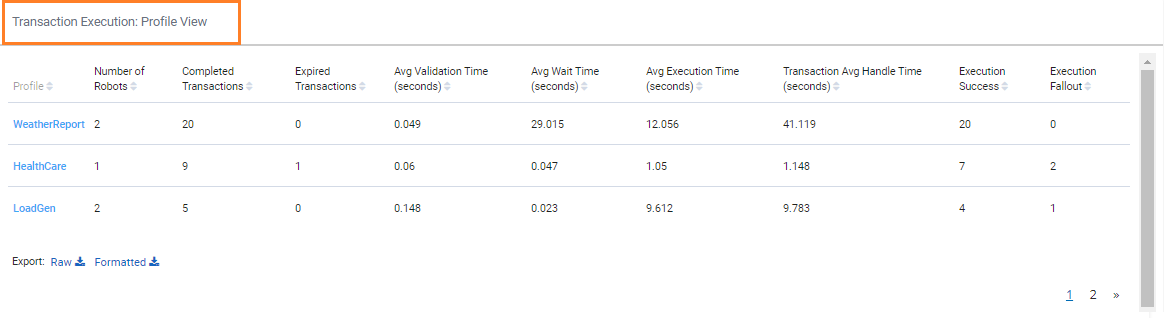
Following table contains field descriptions of the transaction execution: profile view report:
Reports fields |
Description |
Profile |
Indicates the name of profile which are assigned to the robot. |
Number of Robots |
Indicates the number of robots deployed within a particular profile to execute the requests. |
Completed Transactions |
Indicates the number of requests received within a particular profile which are validated as qualified for automation, and are sent to robots for execution. |
Expired Transactions |
Indicates the number of success validation transactions which expired in the queue itself, before any robot picked up for the execution. |
Avg Validation Time (seconds) |
Indicates the average time duration between, when a request is received by the system and when it is declared as qualified or rejected for automation. These data are shown in seconds. |
Avg Wait Time |
Indicates the average time duration between the request received by the robot for execution and the time when robot actually starts executing the request. |
Avg Execution Time (seconds) |
Indicates the average time a robot takes to execute a qualified request (Robot Execution End Time – Robot Execution Start Time). |
Transaction Avg Handle Time |
The average time a request takes to be executed. It is calculated as (Robot Execution End Time – Listener Start Time). |
Execution Success |
Indicates the number of requests which are executed completely by a Robot (with the execution ending gracefully). |
Execution Fallout |
Indicates the number of requests which were not executed completely by a robot, because of one or more errors mentioned in the Execution Success and Execution Failure section of the Transaction Execution Dashboard. |
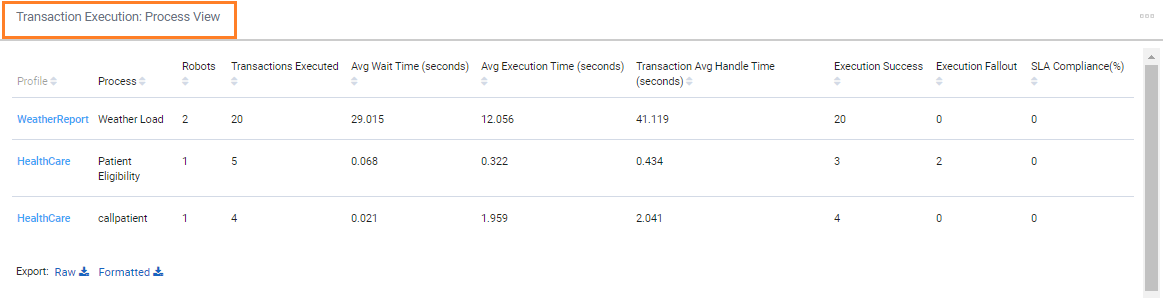
Transaction Execution: Process View
 Transaction
Execution: Process View report provides a tabular representation
of process-wise execution status of incoming requests, validated
as qualified for automation.
Transaction
Execution: Process View report provides a tabular representation
of process-wise execution status of incoming requests, validated
as qualified for automation.
Following is a sample transaction execution: process view report:
Following table contains the Key Performance Indicators (KPIs) used in this report:
Reports fields |
Description |
Profile |
Indicates the name of profile which are assigned to the robot. |
Process |
Indicates the name of process which are assigned to the robot. |
Robots |
Indicates the number of robots deployed to execute the automation of qualified transaction requests for a particular process. |
Transactions Executed |
Indicates the number of requests received within a particular profile which are validated as qualified for automation, and are sent to robots for execution. |
Avg Wait Time (seconds) |
Indicates the average of the time duration between when a request is received by a robot for execution and when the robot starts executing it. |
Avg Execution Time (seconds) |
Indicates the average time taken by a robot to execute a qualified request. It is calculated as AVG (Robot Execution End Time – Robot Execution Start Time). Avg Execution Time is also known as Robot Handle Time. |
Transaction Avg Handle Time (seconds) |
Indicates the average time taken to execute a request. Transaction Avg Handle Time is calculated as (Robot Execution End Time – Listener Start Time. |
Execution Success |
Indicates the number of requests which are executed completely and without any error (ending gracefully). |
Execution Fallout |
Indicates the number of requests which fail to execute completely by a robot because of one or more errors mentioned in the Execution Success and Execution Failure section of the Transaction Execution Dashboard. |
SLA Compliance (%) |
Validates whether a particular automation request was completed and successfully executed within the defined SLA timeline. The process SLA can be defined at the time of deploying a process in the Automation Studio. |
The report can also be downloaded, if required. For more information, see Downloading_Reports.
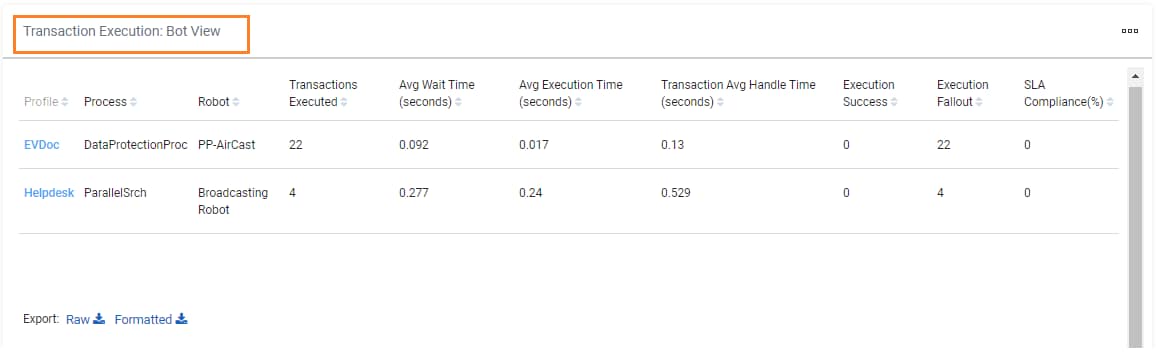
Transaction Execution: Bot View
Transaction Execution:
Bot View report provides a tabular representation of robot-wise
execution status of incoming requests, validated as qualified
automation for each of the processes.
Following is a sample transaction execution: bot view report:
Following table contains the Key Performance Indicators (KPIs) used in this report:
Reports fields |
Description |
Profile |
Indicates the name of profile which are assigned to the robot. |
Process |
Indicates the name of process which are assigned to the robot. |
Robot |
Indicates the number of robots deployed to execute the automation of qualified transaction requests for a particular process. |
Transactions Executed |
Indicates the number of requests received in a particular process validated as qualified for automation and sent to robots for execution. |
Avg Wait Time (seconds) |
Indicates the average time duration between the request received by the robot for execution and the time when robot actually starts executing the request. |
Avg Execution Time (seconds) |
Indicates the average time taken by a robot to execute a qualified request. It is calculated as AVG (Robot Execution End Time – Robot Execution Start Time). Avg Execution Time is also known as Robot Handle Time. |
Transaction Avg Handle Time (seconds) |
Indicates the average time taken to execute a request. Transaction Avg Handle Time is calculated as (Robot Execution End Time – Listener Start Time). |
Execution Success |
Indicates the number of requests which are executed completely by a robot (execution ended gracefully). |
Execution Fallout |
Indicates the number of requests which fail to execute completely by a robot because of one or more errors mentioned in the Execution Success and Execution Failure section of the Transaction Execution Dashboard. |
SLA Compliance (%) |
Validates whether a particular automation request was completed and successfully executed within the defined SLA timeline. The process SLA can be defined at the time of deploying a process in the Automation Studio. |
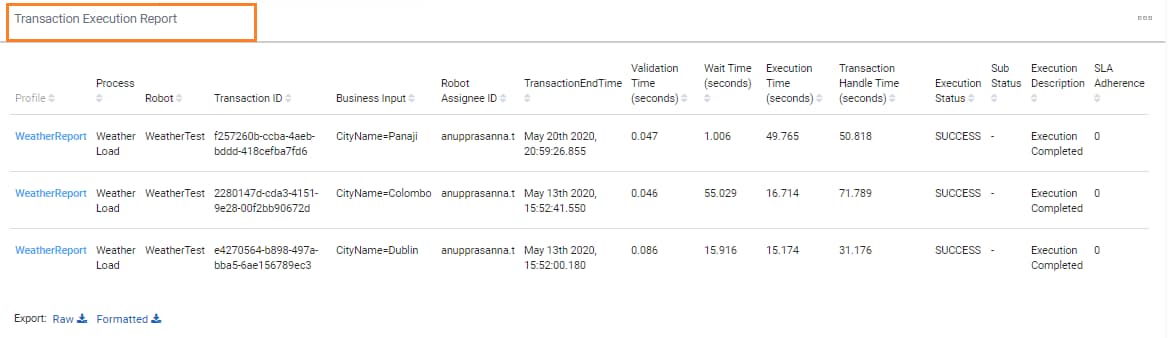
Transaction Execution Report
This
report shows the process and robot wise execution status of the
individual automation requests, validated as qualified for automation.
Following is a sample transaction execution report:
Following table contains the Key Performance Indicators (KPIs) used in this report:
Reports fields |
Description |
Profile |
Indicates the name of profile which are assigned to the robot. |
Process |
Indicates the name of process which are assigned to the robot. |
Robot |
Indicates the number of robots deployed to execute the automation of qualified transaction requests for a particular process. |
Transactions ID |
Indicates the identifier of individual requests received in a particular process which have been validated as qualified for automation, and robots have started their execution. |
Business Inputs |
Indicates the list of search inputs provided as the process input for execution. All the search inputs are entered as key-value pairs in a single column. It helps in creating custom reports as per the business need. |
Robot Assignee ID |
Indicates the Id of the user, to whom the executing robot has been assigned. |
Transaction End Time |
Indicates the date and time at which the transaction execution for an automation request is completed. |
Validation Time (seconds) |
Indicates the time duration between when the request is received by the system and is validated as qualified for automation. |
Wait Time (seconds) |
Indicates the time difference between when a request is received by the robot for execution and when the robot starts executing it. |
Execution Time (seconds) |
Indicates the time taken by a robot to execute a qualified request and is calculated as (Robot Execution End Time – Robot Execution Start Time). Execution time is also known as Robot Handle Time. |
Transaction Handle Time (seconds) |
Indicates the time taken by a request for execution and is calculated as (Robot Execution End Time – Listener Start Time) for that transactional request. |
Execution Status |
Indicates the execution status of a particular transaction request if it is completed, and ended gracefully without any error. |
Sub Status |
Indicates the execution status of a particular transaction request if it is completed, and ended gracefully without any error. |
Execution Description |
Indicates the failure description aligned with the fallout code of a transaction request, if the execution of that request was not completed gracefully. |
SLA Adherence |
Displays whether the execution of a particular request is processed successfully within the defined SLA time. |
The report can also be downloaded, if required. For more information, see Downloading_Reports.
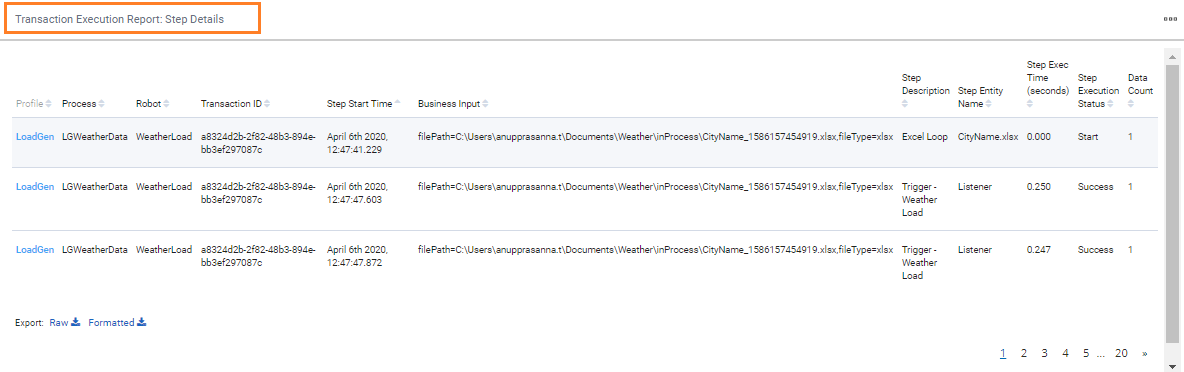
Transaction Execution Report: Step Details
Transaction
Execution Report:Step Details report provides a detailed
step-wise execution view of the individual transaction requests,
validated as qualified for automation. In case of anomalies, it
helps in identifying where the exception has occurred, which application
was under use, and so on.
It supports the diagnosis of the functionality of an application, and if the handling time is continuously increasing while executing the automation requests of any process.
Following is a sample transaction execution report: step details:
Following table contains the Key Performance Indicators (KPIs) used in this report:
Reports fields |
Description |
Profile |
Indicates the profile identifier of an individual transaction request validated as qualified for automation. |
Process |
Indicates the process identifier of an individual transaction request validated as qualified for automation. |
Robot |
Indicates the identifier of the robot executing a particular transaction request. |
Transactions ID |
Indicates the identifier of individual request received in a particular process which is validated as qualified for automation, and robots have started their execution. |
Step Start Time |
Indicates the date and time when the automation request was started by particular process. |
Business Input |
Indicates the list of search inputs provided as a process input for execution. All search inputs are entered in key-value pairs in a single column. It helps to create custom reports as per the business need. |
Step Description |
Indicates the description of a particular step executed by the robot. The description is same as defined in DisplayName while creating the process. |
Step Entity Name |
Indicates the application used in a particular step while a robot executes the request. |
Step Exec Time (seconds) |
Indicates the time taken by a robot to execute a particular step while executing the automation qualified request. |
Step Execution Status |
Indicates the execution status of a particular step such as Success or Failure. |
Data Count |
Indicates the number of document count based on which given table row is created. |
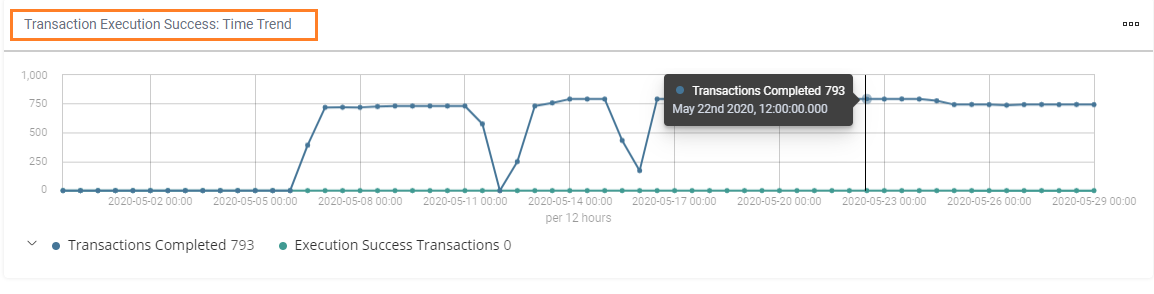
Transaction Execution Success: Time Trend
Transaction Execution
Success: Time Trend report is used to
analyze a time trend of the proportion of completed executions
(with graceful ending of the process) among the incoming requests,
validated as qualified for automation for the chosen time duration
across processes. The report displays the numbers of validation
success transactions and Execution Success Transactions on the
time-axis.
Following is a sample transaction execution success: time trend:
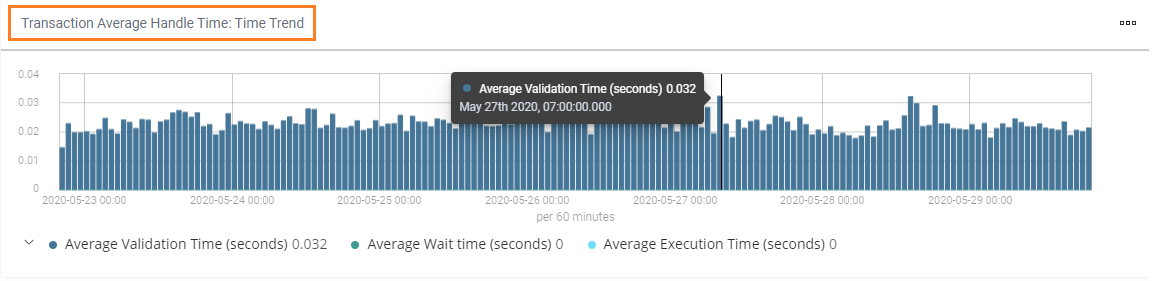
Transaction Average Handle Time: Time Trend
Transaction Average
Handle Time: Time Trend report
is used to analyze the time trend view of the average handle time
to execute automation qualified requests for the chosen time duration
across processes.
This report displays the stacked bar chart of average validation time, average wait time, and average execution time over the time duration chosen. All the time values are measured in seconds.
Following is a sample transaction average handle time: time trend:
Following are the three columns displayed in this graph:
Trend- Reports |
Description |
Avg Validation Time |
Indicates the average of the time duration between when a request is received by the system and when it is declared as qualified or rejected for automation. |
Avg Wait Time |
Indicates the average time duration between the request received by the robot for execution and the time when robot actually starts executing the request. |
Avg Execution Time |
Indicates the average time a robot takes to execute a qualified request. It is calculated as AVG (Robot Execution End Time – Listener Start Time). Avg Execution Time is also known as Robot Handle Time. |
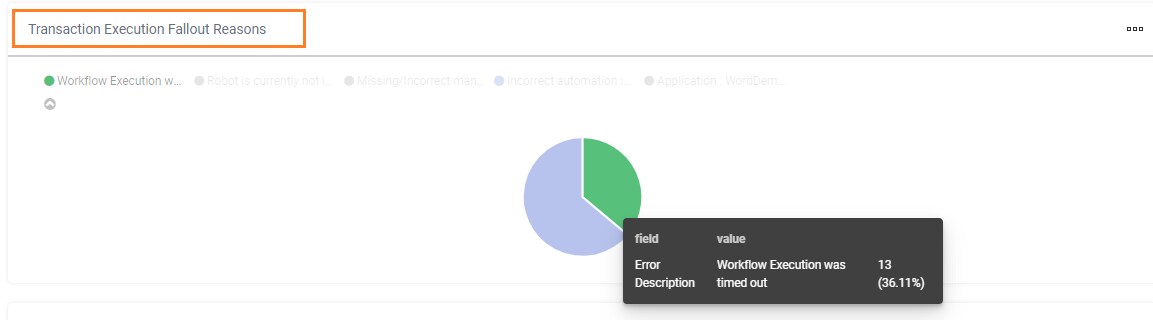
Transaction Execution Fallout Reasons
Transaction
Execution Fallout Reasons report is a pie chart report with a
distribution of reasons, preventing the execution of transaction
requests to complete gracefully.
Following is a sample transaction execution fallout reasons report:
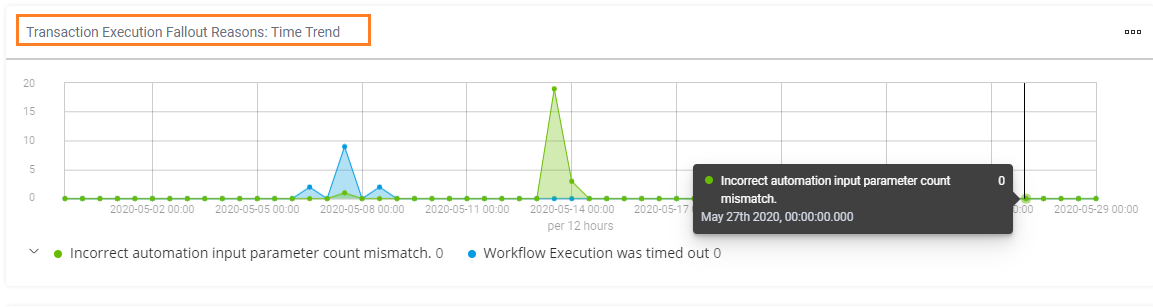
Transaction Execution Fallout Reasons: Time Trend
Transaction Execution Fallout Reasons: Time Trend report is used to analyze the time trend view of the reasons behind the incomplete execution of automation qualified requests (execution not ended gracefully) for the preferred time duration across processes.
Following is a sample page of the transaction execution fallout reasons: time trend report:
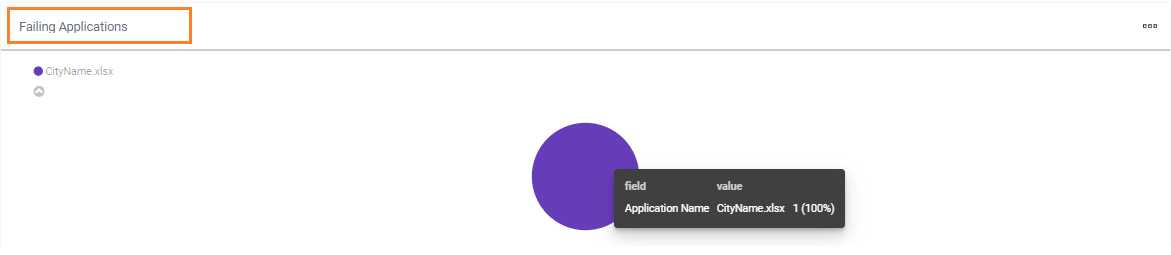
Failing Applications
Failing
Applications report captures the frequently failing applications
while executing automation qualified requests for the chosen time
duration across processes. Additionally, it captures the application
(entity) in use at the step when a particular transaction is not
executed completely (gracefully).
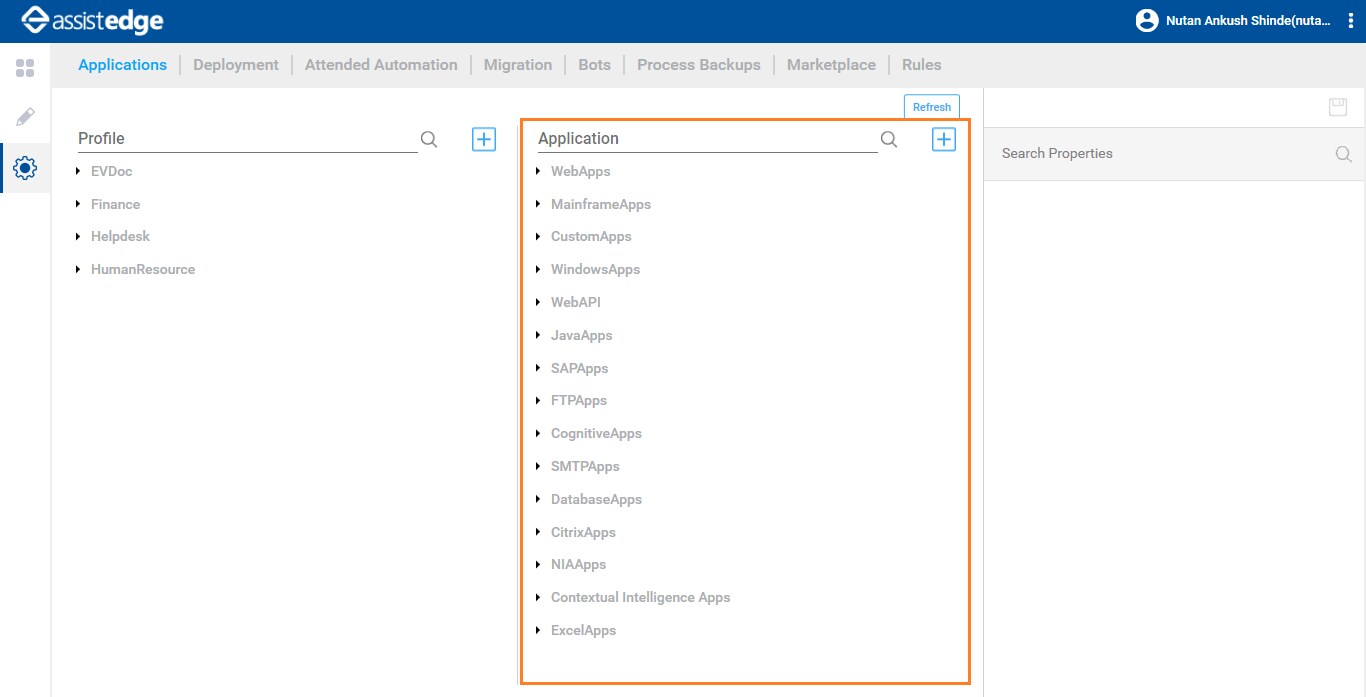
Applications defined in AssistEdge Automation Studio are displayed in this report.
Following is a sample page of the Failing Applications report:
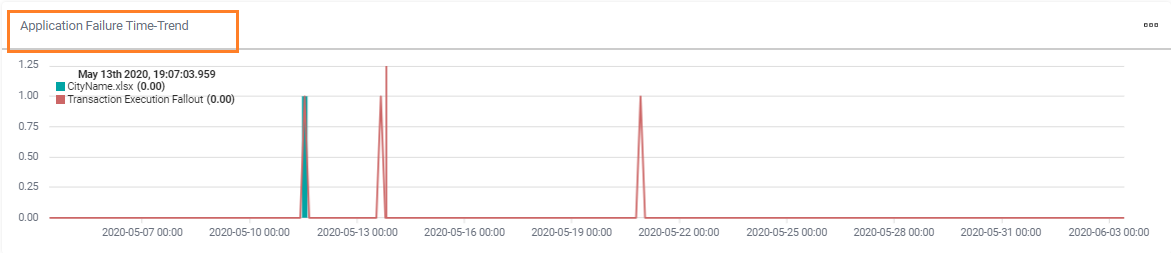
Application Failures: Time Trend
This
report is used to analyze the time trend view of the failing applications
while executing qualified automation requests for the chosen time
duration across processes.
Following is a sample page of the application failures: time trend report:
Following is the list of KPIs used in this report:
Trend- Reports |
Description |
Failed Execution |
Indicates the number of requests which are not executed successfully because of an error. |
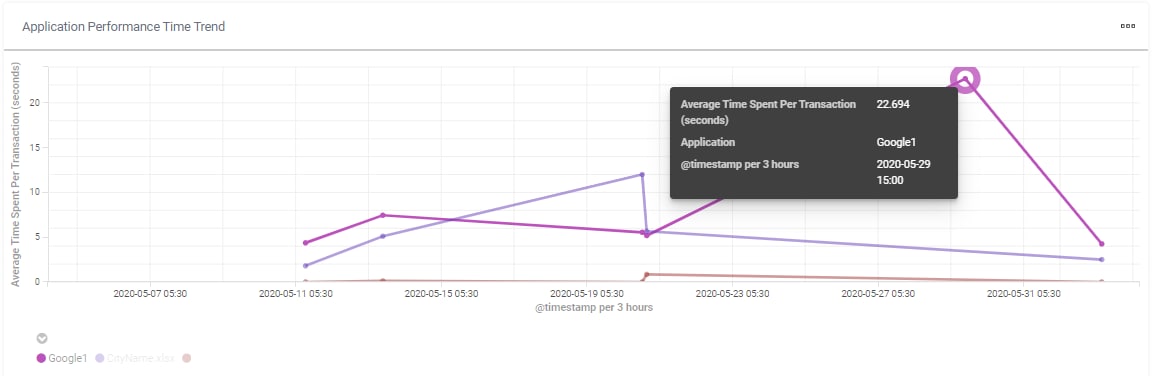
Application Performance Time Trend
Application Performance Time Trend report is used to analyze the performance pattern of applications across a given duration of time as chosen by the user. The primary objective of this report is to understand if a certain application is introducing performance issues by comparing it to the previous time trend.
Following is a sample page of the time trend report:
On This Page Hide
Transaction Execution: Profile View
Transaction Execution: Process View
Transaction Execution: Bot View
Transaction Execution Report: Step Details
Transaction Execution Success: Time Trend
Transaction Average Handle Time: Time Trend
Transaction Execution Fallout Reasons
Transaction Execution Fallout Reasons: Time Trend
Related Topics