Custom Business Reports and Dashboard
AE RPA enables you to create new or custom dashboard and custom business reports as per your preference.
Creating Custom Business Reports
AE RPA enables you to enhance the reporting capabilities, and lets you create custom reports. You can create or edit the reports as per your requirements.
Using Kibana, you can also create custom business reports. Custom business reports allow you to schedule and also distribute the dashboards with custom charts as hourly, daily, weekly and monthly PDF and excel reports.
Prerequisites
Before starting, ensure that you have done following:
- Reporting component should be in running state.
- Logged-in user should have relevant access to reporting page and concerned tabs such as Visualization, Management and so on in reporting.
- Ensure that business metric category process for particular activity is captured in Automation Studio. For more information about capturing business metric activity, see Creating Custom Business Reports.
Before Starting with Custom Business Reports
Before starting with custom business reports, verify the prerequisites.
Business Metric Activity enables you to track, monitor and analyze the quantified measures that estimates the success or failure of business processes. This activity provides an insight into the business before actually diving into the core business data.
To set the business metric activity for reports:
- In the Automation Studio, create a Business Metric Activity. For more information about Business Metric activity, see Business Metric Activity section in the AE-RPA-Engage-Automation Guide.
- In the Activity window, click the
 (setting) icon.
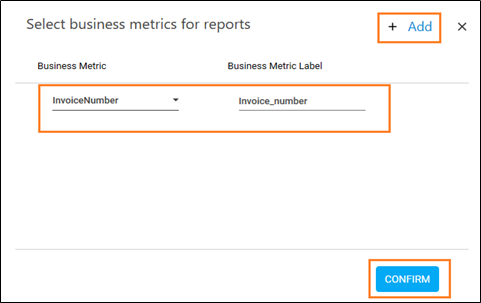
The Select business metrics for reports window is displayed.
- Click the
 (Add) icon to select the business metrics for reports.
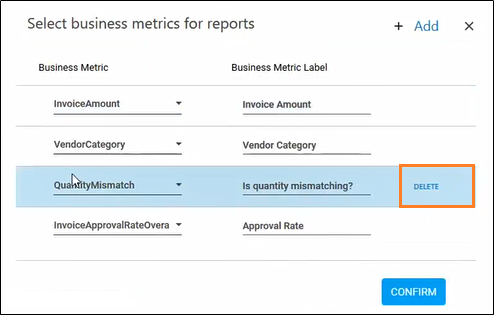
- Click the
 (Delete) icon against business metric to delete any business metrics for reports.
- Click the
- From the Business Metric, select the argument for business metric reports from the drop-down list.
- In the Business Metric Label field, enter the label in which the business metrics will be stored in the logs.
- Click CONFIRM to add the business metrics for reports. The business metric category for particular activity is captured and logged in the admin module.
Creating Custom Business Reports
After the creation of business metrics category, access the Reporting tab to customize the RPA reports. In Kibana, all the newly created business metrics category is saved under datareport Index pattern. The naming convention for the newly created category is <Index pattern name>-<profilename>-<processname>.
If you want to create multiple processes, then you can group the categories under same Indexpattern. Every day a new index pattern log file is created. For example, in the below scenario Invoice category is created under Business Metrics Activity in the Automation Studio.
To customize the RPA reports:
- Log in to Admin Module using relevant administrator credentials.
- Go to Reporting > Reports. The Reports window is displayed.
- Navigate to Management > Stack Management tab.
- Click Index Patterns > Create index patterns.
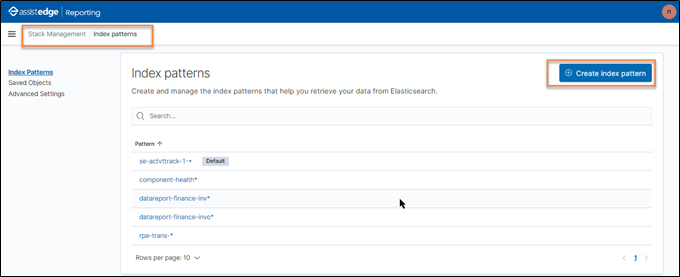
The Create index patterns page is displayed.
- In the Index pattern field, enter index pattern name using the conditions mentioned in the following page. For example, specify <datareport-finance-Invoice*>. Putting the asterisk sign after index pattern enables to list down all the log files with that particular index pattern name.
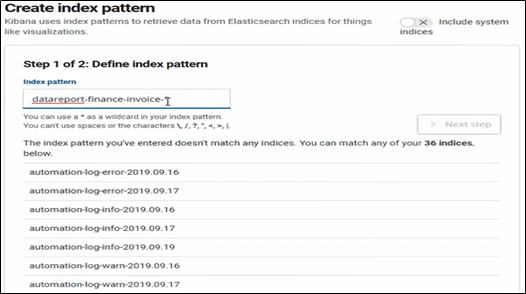
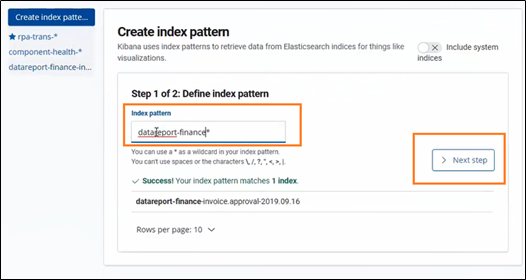
A success message as Success!Your Index pattern matched <1>Index appears on the page.
Click Next step.
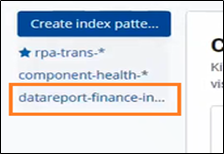
- The <Index pattern name>-<profilename>-<processname> is added to the Index pattern list. For example, in the above scenario, <data report-finance-invoice> is added to the index-pattern list.
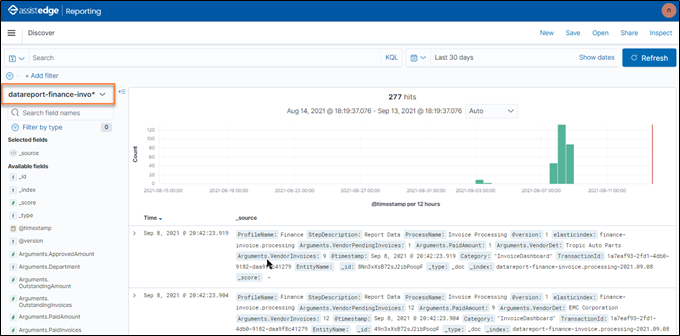
- Navigate to Discover in order to verify whether the data is logged correctly. From the Add a filter, select the Index pattern for which you want to check the data. Additionally, you can also change the duration.
- After verifying the data, navigate to Visualize tab.
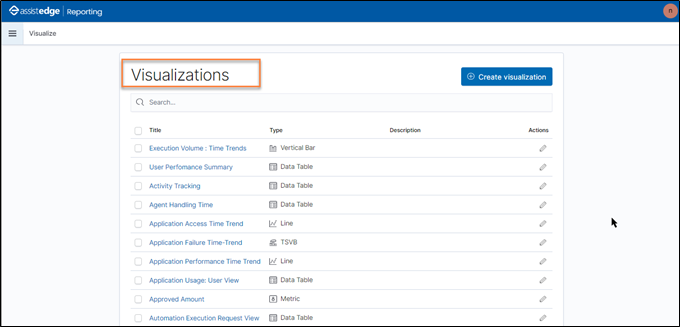
- Click the
 icon to start creating the reports.
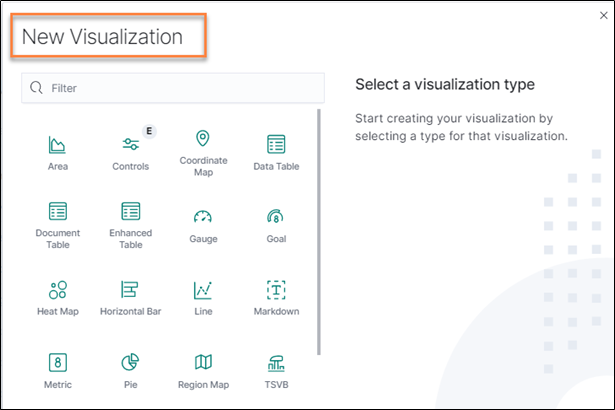
The New Visualization window is displayed.
- Select the preferred New Visualization filter such as metrics. For more information about New visualization, see Creating Visualization section.
- From the New Visualization page, select the newly created index pattern. Specify the required filter for the visualization as show in following page. In the following page, Metric Visualization is used.
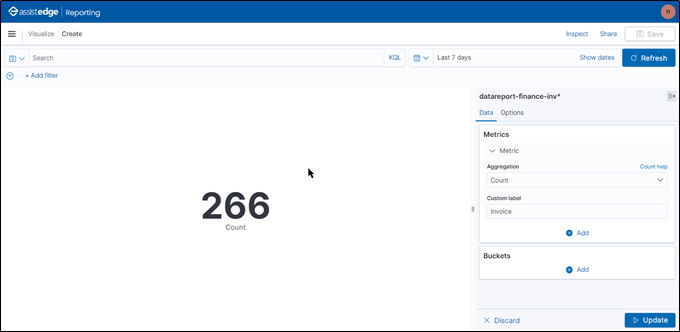
- Click Save.
The Save visualization window is displayed.
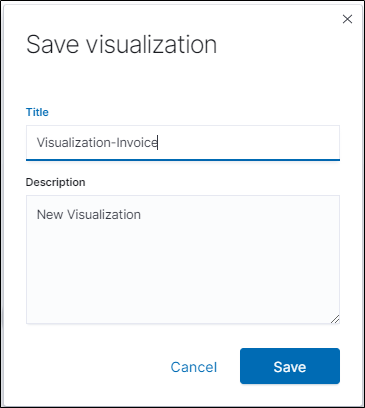
- Then, specify a name for the visualization and click Save.
The new report is saved.
For more information about dashboard, see Creating New or Custom Dashboard section.