Process View (Manager Role Homepage)
This section helps you to understand the homepage of Decision Workbench. This page applies to you if the Decision Workbench process is created in the Studio and the robot is created to trigger the Decision Workbench process.
|
NOTE: |
This is a default homepage of decision workbench. Applicable, if the Decision Workbench process is not created in the Studio or the robot is not created to trigger the Decision Workbench process. |
For more information about Decision Workbench activity, see Automation Studio.
For more information about creating and triggering a robot, see Control Tower.
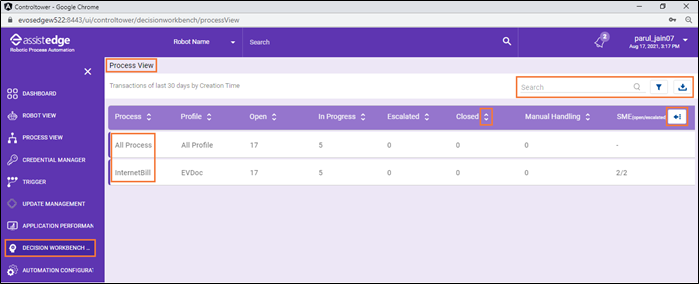
In the Process View, you can view the total number of requests pending for human action in the process and an associated profile.
To view the list of transactions available in the Decision Workbench:
- Click the required process name to view the associated process transactions.
OR
- Click All Process to view all the available transactions in the Decision Workbench queue.

|
NOTE: |
To Know about the column description, see the Decision Workbench Transaction View section. |
Following is the list of available features in Decision Workbench to make the user journey seamless.
- Search: You can use this feature to view the particular process or profile.

Enter the name of the required process or profile in the Search field and click the (Search) icon. The requested process or profile details appear.
- Filter:
You can use this feature to view the process details as per the time it was created or updated. Additionally, you can modify the total number of transaction days. By default, the last 30 days' transactions are displayed.
- Click the
 (Filter) icon. The Filter window appears.

- In the Enter Days field, enter the total number of days for which you want to view the transactions.
- In the Time View list, select the type of time. The available options are:
- Created On: The filter displays the available transactions based on the creation time.
- Updated On: The filter displays the available transactions based on their update time.
- Click Apply to save the changes, else click the
 (Close) icon to discard the changes.
- Download:
This feature is used to download the available content on screen in excel format.
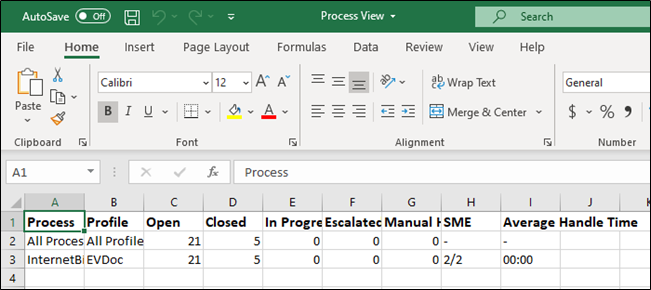
- Click the
 (Download) icon. The available process view details are downloaded in excel format.
- Column Settings:
This feature is used to modify the column display settings.
- Click the
 (Column Settings) icon. The Column Settings window appears.
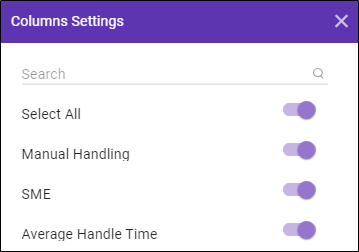
- Toggle to select and deselect the column display settings. The available toggles are Select All, Manual Handling, SME, Average Handle Time.
- Additionally, you can search for the column name in this window.
- In the Search field, enter the required column name.
- Click the
 (Search) icon to view the required column and its toggle.
- Click the
 (Close) icon to save and close the window.
- Sorting: This feature is used to sort the column view in ascending and descending order.
- Click the
 (Sort) icon to make a selection.
- The
 (Up Arrow) icon indicates ascending order.
 - The
 (Down Arrow) icon indicates descending order.
- The
- Additionally, a filter option is available with the Process and Profile column. To view the filter, drag the cursor near Sort icon. The
 (Filter) appears.
- Click the
 ( Filter) icon. A filter window appears to filter the column.
 - In the Search field, enter the name of the required process/profile based on your filter selection.
- Click the
 (Search) icon.
- Click the