Test Run Process
Testing a process executes all the steps involved in the process workflow. The output of the process can be viewed to ensure that the desired output is received.
Test run can be performed after you have setup the environment. If you do not setup environment and initiate the test run, the system automatically sets up the environment once you click Test Run.
To test run a process:
1. In the Home menu, open the process you want to test. The process workflow opens in the Flowchart designer.
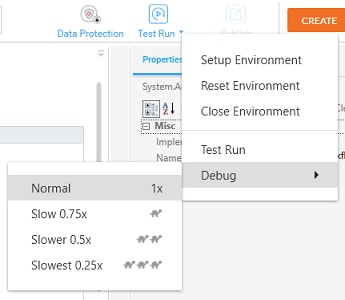
2. In the Tool bar, click the Test Run list and then click Test Run.
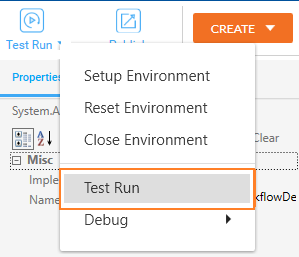
3. The system initiates the test for the entire process workflow.
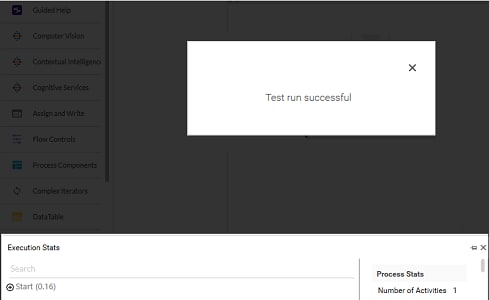
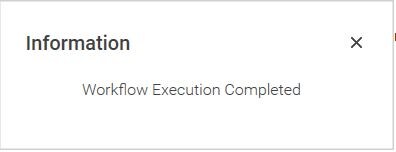
A message for successful test run is displayed. Additionally, the information related to the execution of the process is available in the Execution Stats panel. You can view Execution Stats in the Status Bar to know the details related to the process execution like CPU utilization, memory consumed.
Debug
It allows you to debug an automation process workflow to identify and remove errors, if any. You can perform debugging by adding breakpoints to pause the process execution and then check, detect and correct the error.
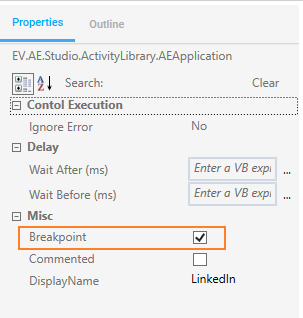
You can mark an activity as a breakpoint by selecting the Breakpoint check box in the Properties grid.
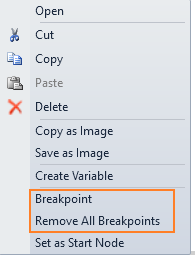
Alternatively, right click an activity and select Breakpoint or press F9 key to set a breakpoint. You can remove the breakpoint by clicking Breakpoint or Remove All Breakpoints to remove all the breakpoints at once.
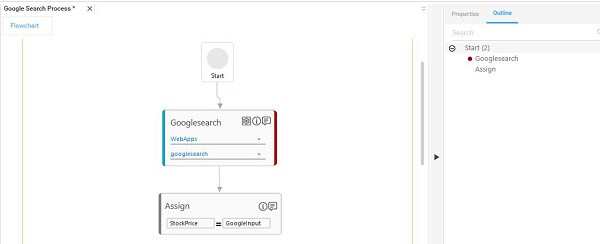
The activity gets highlighted in red where breakpoint is set. Additionally, it is marked with a red dot in the Outline grid.
To debug a process:
1. Set the breakpoints in the process workflow.
2. Click Test Run, select Debug, and then select the required speed to debug the process. The available options are from Normal to slower speed. Slow speed helps you with extra time to analyze the process execution and detect the errors.
The Debug panel appears and the process execution starts. The execution stops at the breakpoint highlighting the name of the activity in red. You can press F5 key to resume the debugging.
3. You can:
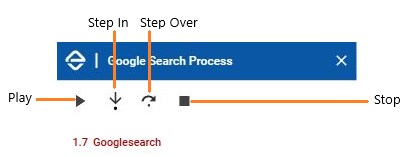
a. Click Step In to execute all the activities within the activity where the breakpoint is set. This is applicable only when there are nested activities within the parent activity.
b. Click Step Over to jump to the next activity after the breakpoint.
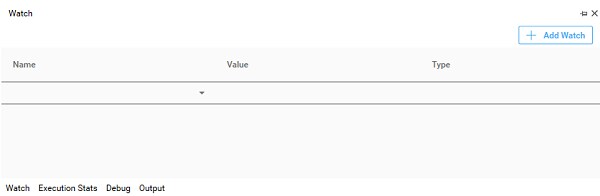
4. In the Status bar, click Watch panel, and then click Add Watch to add arguments or variables. This would help in tracking the changes in the value assigned while debugging the process. You can add multiple arguments or variable in the Watch panel.
5. Click Play to resume the debugging.
6. Repeat the above steps for the remaining activities and breakpoints in the entire process.
The debugging of the process workflow is completed.
7. Alternatively, click Stop to abort the debugging.
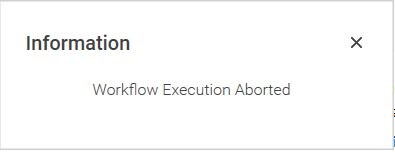
The debugging stops.
Once the testing is successful, you can publish the process to view and to reuse it. See Publish Process to know how to publish a process in Automation Studio.
Related Topics