Introduction
SLA Report provides you with high-level reports on the performance of processes where an SLA is implemented.
Prerequisites
Before such report can be generated, one must first enable the Process Data Collector for each and every intended Joget app.
Please see Enabling Data Collection for SLA Implementation for more info.
SLA Report Properties
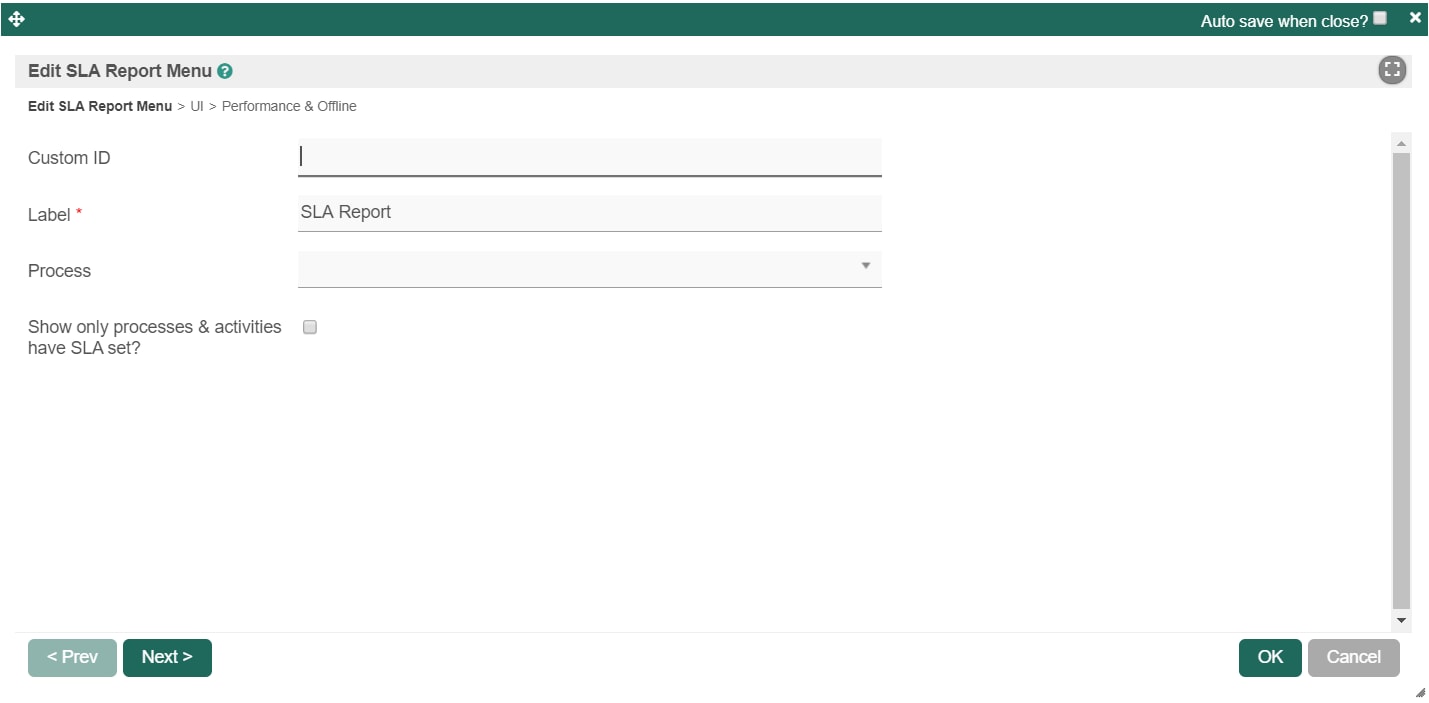
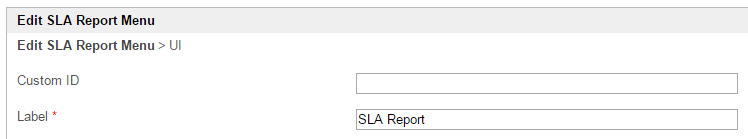
Edit SLA Report Menu
| Name | Description | Screens (Click to view) |
|---|---|---|
| id | Menu element unique id. Userview will use this id in the URL for the menu if the Custom ID is empty. |
Figure 1: SLA Report Properties
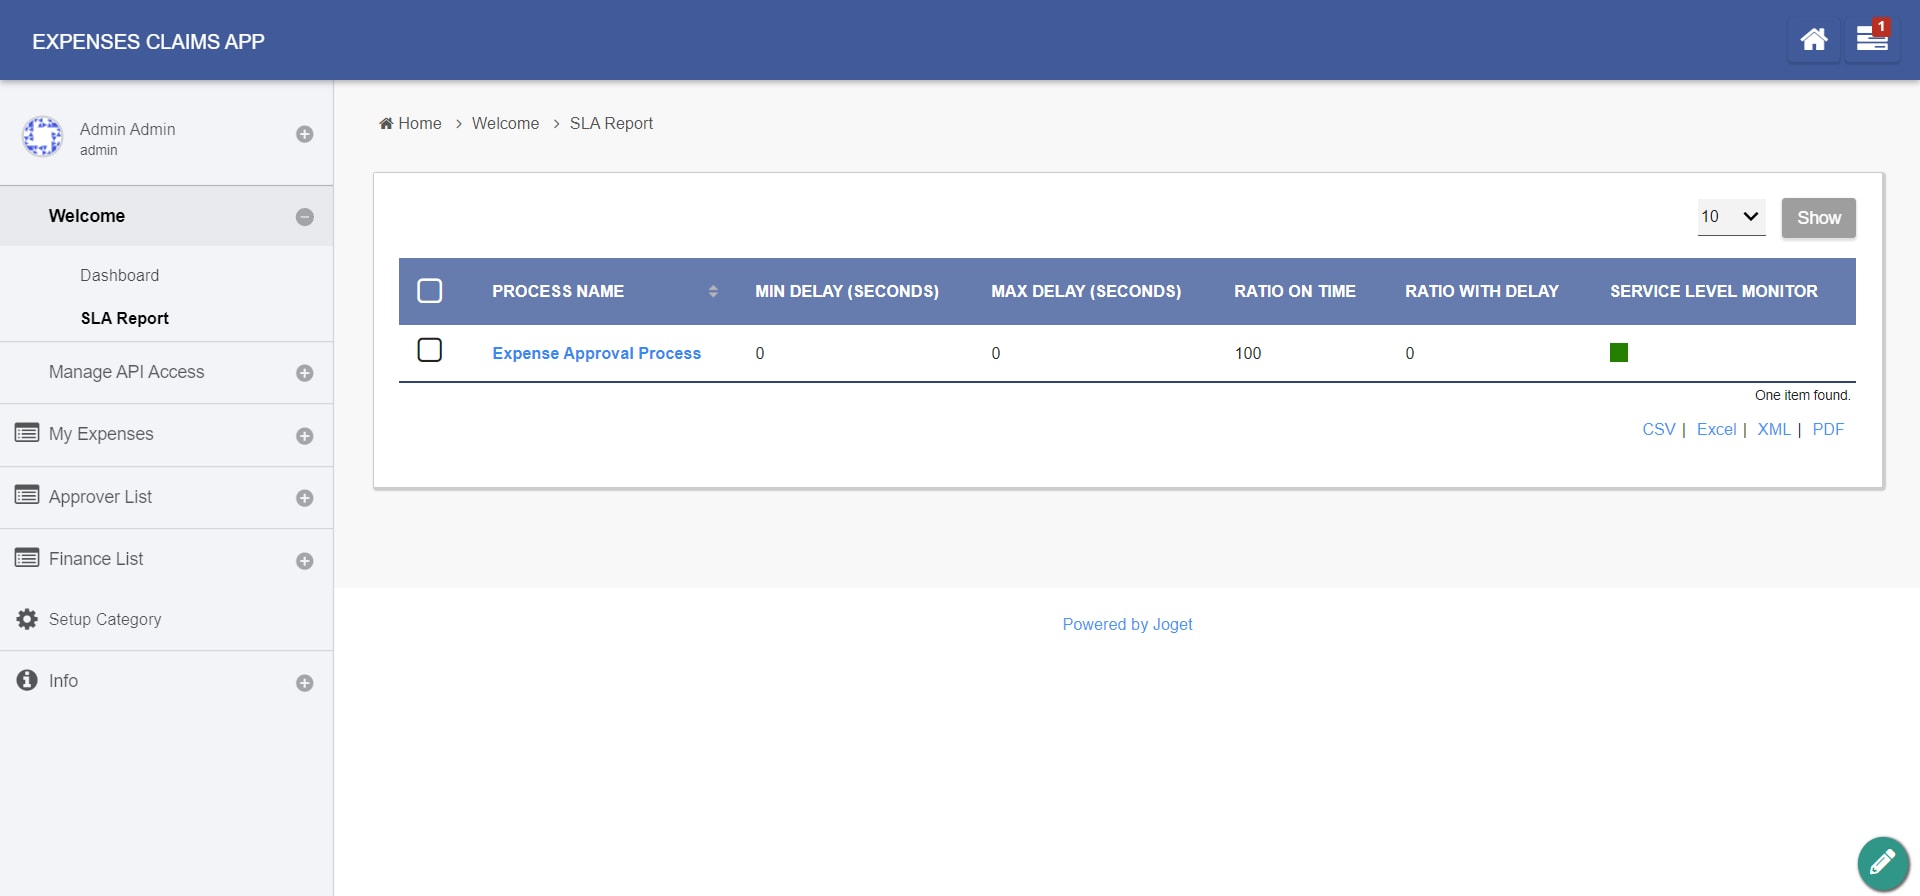
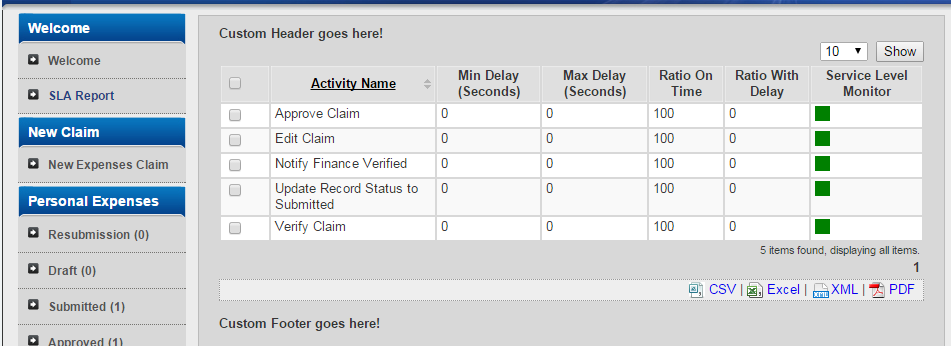
Figure 2: Sample SLA Report in runtime |
| Custom ID | Item link slug. Optional field. Unique field Ensure that value defined here is unique to other userview menus in the app, since the first matching/conflicting ID will take precedence in page loading. | |
| Label | The userview menu label. | |
| Process | Limit the SLA results to a specific process in the current app. | |
| Show only processes & activities have SLA set? | Limit the report results only to process(es) and activity(s) that has SLA configured on. |
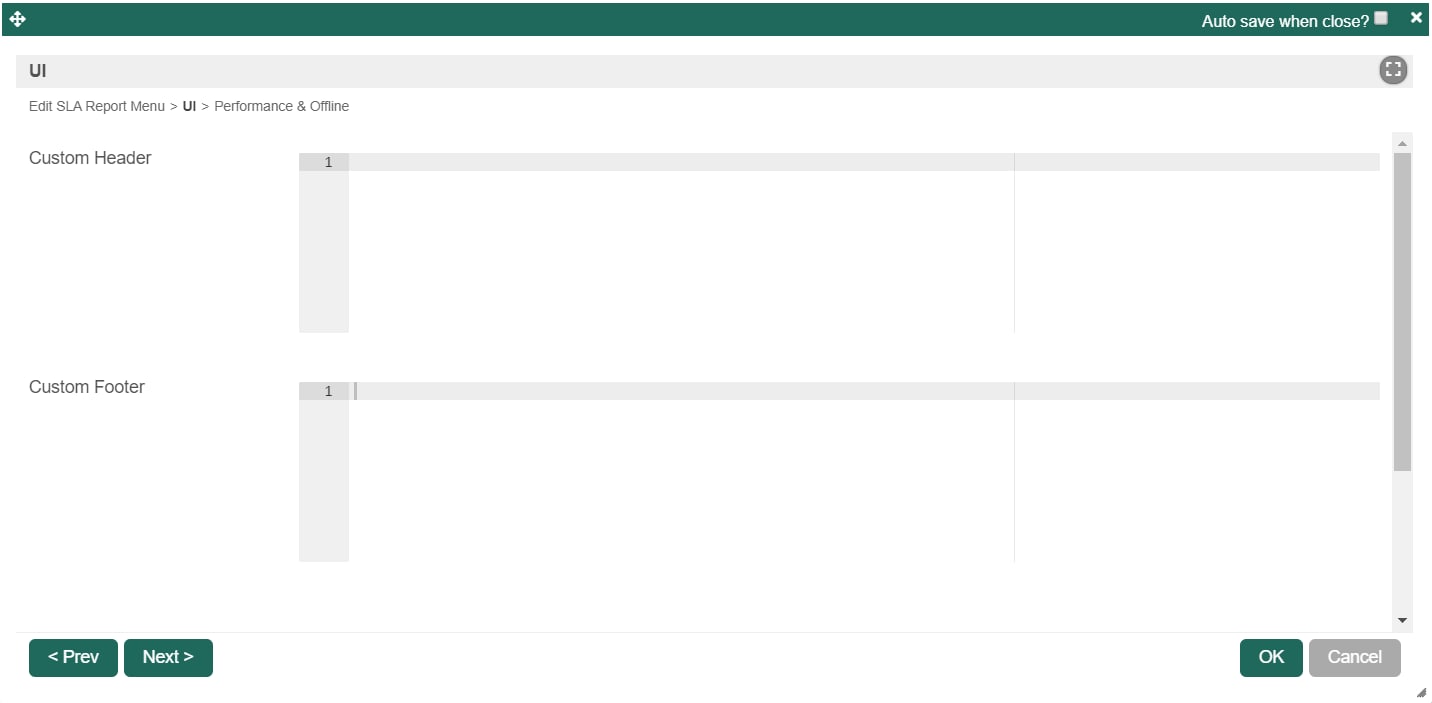
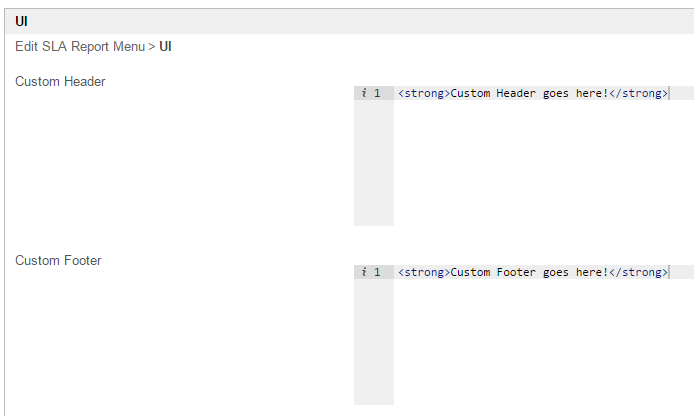
UI
| Name | Description | Screens (Click to view) |
|---|---|---|
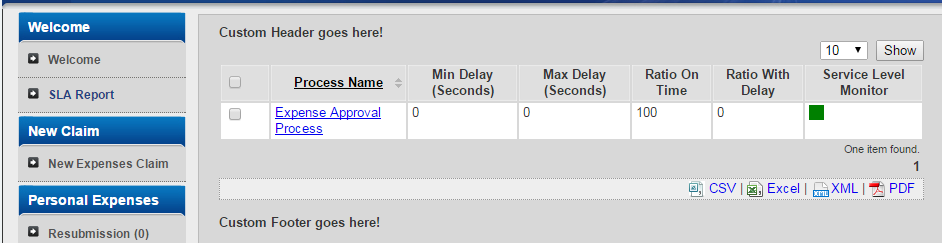
| Custom Header | Custom Header in HTML. |
Figure 3: UI Properties |
| Custom Footer | Custom Footer in HTML. |
SLA Report Run Time View
The userview SLA Report menu provide two views:
- First level: overview of all process SLA
- Second level: overview of all activities under the selected process (accessed by clicking the process name in first level view).
If your app has uncompleted activities/tasks, the 'Max Delay' timer will continue to increment as the system calculates the maximum delay time based on current time.
Guide To The SLA Display Columns
- Min Delay (Seconds): The shortest (minimum) delay across all activities per process.
- Max Delay (Seconds): The longest (maximum) delay across all activities per process. This value will continue to increment as long as there are pending or uncompleted activities for each process.
- Ratio On Time (%): Percentage count of activities completed on time or 'no delays' divided by total activities.
- Ratio With Delay (%): Percentage count of activities delayed divided by total activities.
- Service Level Monitor: Ratio On Time vs Service Level indicator configured in General Settings fields 'Medium Warning Level' and 'Critical Warning Level. If the 'Ratio On Time' is less than Medium Warning Level, it will change color to yellow. If the 'Ratio On Time' is less than Critical Warning Level, it will change color to red.
Performance & Offline
Cache Settings
Name | Description |
|---|---|
| Scope | Caching options are:
|
| Duration (s) | Duration in seconds to cache content, defaults to 20 seconds if applicable. |
Read more at Performance Improvement with Userview Caching.
PWA Offline Settings
Note: PWA Offline support is dependent on the theme used.
Name | Description |
|---|---|
| Enable cache for offline support | Enable caching for offline support, usually set for use on mobile browsers. |
| Cache all datalist links in first page | Enable caching for any datalist links present in the first page of this userview menu. |
Read Progressive Web Application (PWA) for more information.