Custom Business Reports and Dashboard
Digital Worker enables you to create new or custom dashboard and custom business reports as per your preference.
Creating Custom Business Reports
Digital Worker enables you to enhance the reporting capabilities, and lets you create custom reports. You can create or edit the reports as per your requirements.
Using OpenSearch Dashboards, you can also create custom business reports. Custom business reports allow you to schedule and also distribute the dashboards with custom charts as hourly, daily, weekly and monthly PDF and excel reports.
Prerequisites
Before starting, ensure that you have done following:
- Reporting component should be in running state.
- Logged-in user should have relevant access to reporting page and concerned tabs such as Visualization, Management and so on in reporting.
- Ensure that business metric category process for particular activity is captured in Automation Studio. For more information about capturing business metric activity, see Before Starting with Custom Business Reports.
Before Starting with Custom Business Reports
Before starting with custom business reports, verify the prerequisites.
Business Metric Activity enables you to track, monitor and analyze the quantified measures that estimates the success or failure of business processes. This activity provides an insight into the business before actually diving into the core business data.
To set the business metric activity for reports:
- In the Automation Studio, create a Business Metric Activity. For more information about Business Metric activity, see Business Metric Activity section in the Automation Studio.
- In the Activity window, click the
 (setting) icon.
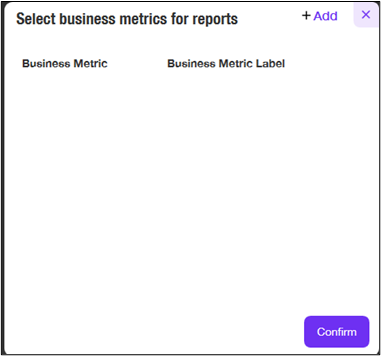
The Select business metrics for reports window is displayed.
- Click the
 (Add) icon to select the business metrics for reports.
- Click the
 (Delete) icon against business metric to delete any business metrics for reports.

- Click the
- From the Business Metric, select the argument for business metric reports from the drop-down list.
- In the Business Metric Label field, enter the label in which the business metrics will be stored in the logs.
- Click Confirm to add the business metrics for reports. The business metric category for particular activity is captured and logged in the admin module.
Creating Custom Business Reports
After the creation of business metrics category, access the Reporting tab to customize the Digital Worker reports. In OpenSearch Dashboards, all the newly created business metrics category is saved under datareport Index pattern. The naming convention for the newly created category is <Index pattern name>-<profilename>-<processname>.
If you want to create multiple processes, then you can group the categories under same Indexpattern. Every day a new index pattern log file is created. For example, in the below scenario Invoice category is created under Business Metrics Activity in the Automation Studio.
To customize the Digital Worker reports:
- Log in to Admin Module using relevant administrator credentials.
- Go to Reporting > Reports. The Reports window is displayed.
- Navigate to Dashboard Management.
- Click Index Patterns > Create index patterns.
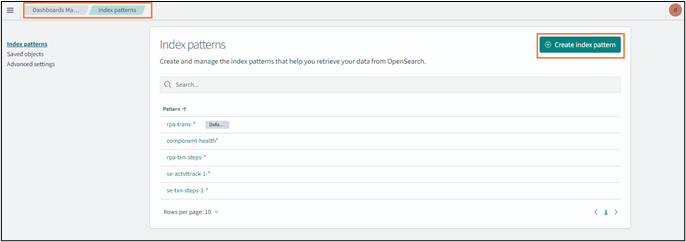
The Create index patterns page is displayed.
- In the Index pattern field, enter index pattern name using the conditions mentioned in the following page. For example, specify <datareport-training-vendorprocess*>. Putting the asterisk sign after index pattern enables to list down all the log files with that particular index pattern name.
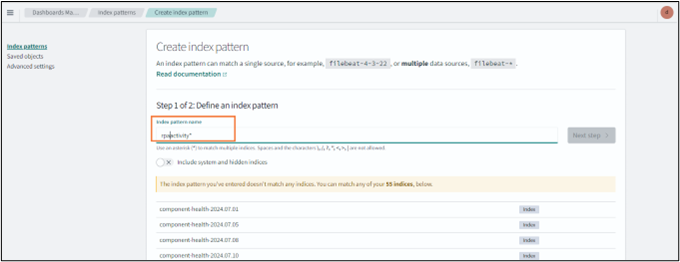
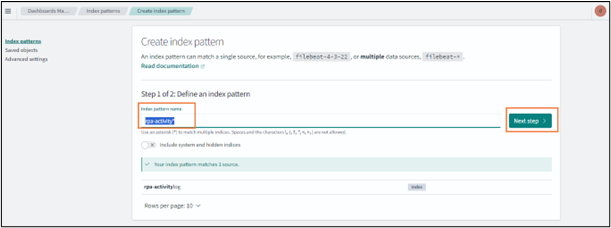
A success message as Success!Your Index pattern matched <1>Index appears on the page.
Click Next step.
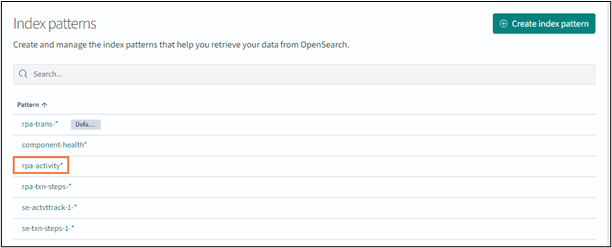
- The <Index pattern name>-<profilename>-<processname> is added to the Index pattern list. For example, in the above scenario, <datareport-training-vendorprocess*> is added to the index-pattern list.
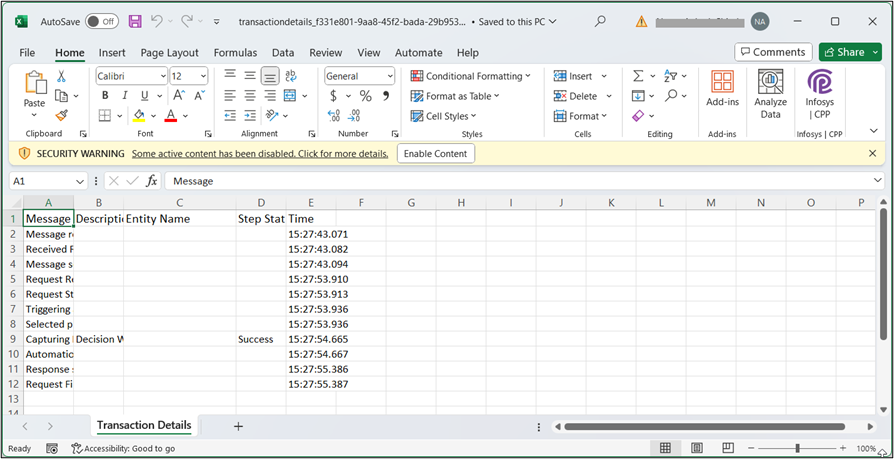
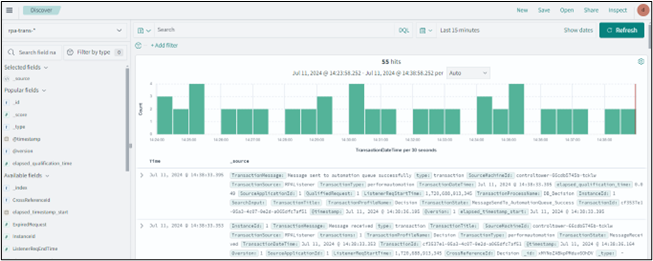
- Navigate to Discover in order to verify whether the data is logged correctly. From the Add a filter, select the Index pattern for which you want to check the data. Additionally, you can also change the duration.
- After verifying the data, navigate to Visualize tab.
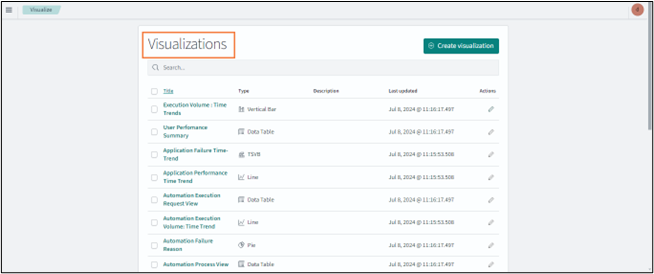
- Click the
 icon to start creating the reports.
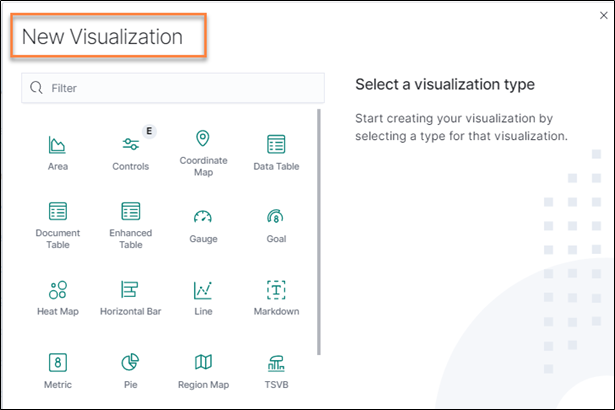
The New Visualization window is displayed.
- Select the preferred New Visualization filter such as metrics. For more information about New visualization, see Creating Visualization section.
- From the New Visualization page, select the newly created index pattern. Specify the required filter for the visualization as show in following page. In the following page, Metric Visualization is used.
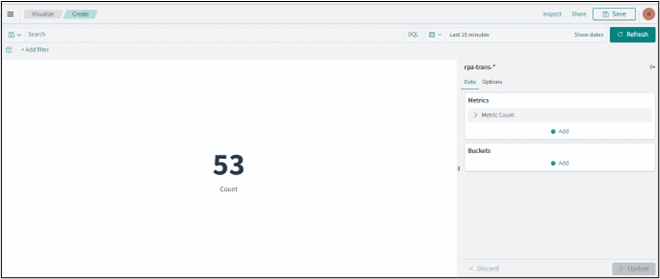
- Click Save.
The Save visualization window is displayed.
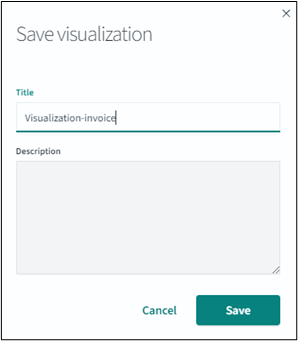
- Then, specify a name for the visualization and click Save.
The new report is saved.
For more information about dashboard, see Creating New or Custom Dashboard section.
Digital Worker enables you to create new or custom Dashboard as per your preference. Using dashboard, you can view the data at glance into details. You can view and edit the data to find out the data to displays on dashboard as per your preference.
Creating New or Custom Dashboard
Prerequisites
Before starting, ensure that you have done following:
- Reporting component should be in running state
- Logged-in user should have relevant access to reporting page and concerned tabs such as Visualization, Management and so on in reporting.
Before Starting with Creating New or Custom Dashboard
To get started with creating new or customizing dashboard, you require following:
- Data indexed into OpenSearch.
- A default Index pattern (. rpa-trans-* and rpa-txn-steps-*) created to retrieve the data from OpenSearch. For more information about creating Index pattern, see Creating_an_Index_Patterns.
- At least one saved visualization. For more information about creating visualization, see Creating_Visualization.
|
NOTE: |
User who possess edit access only can create or edit the dashboard. For more information about edit option in Reporting, see Specify role access section in Administrator. |
Creating New or Custom Dashboard
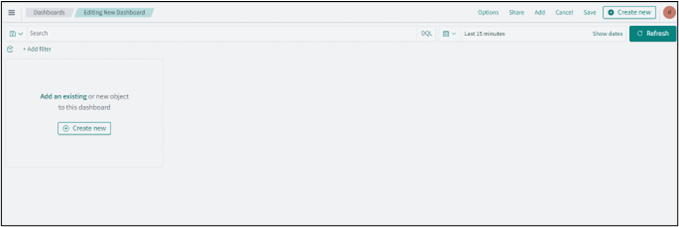
When you click the Dashboard tab for the first time, an empty dashboard is displayed. Here, you can build a new dashboard or custom dashboard as per your preference by adding visualizations.
To create a new dashboard:
- Navigate to Dashboard > Create New Dashboard. The New Dashboard page is displayed.
- At the top right corner or on the dashboard page, click Add. It displays the list of newly created visualization.
- At the top corner, you can find options such as Save, Cancel, Add, Options, Share, Auto-refresh and also change the time to get the data on the dashboard.
- At the top corner, you can find options such as Save, Cancel, Add, Options, Share, Auto-refresh and also change the time to get the data on the dashboard.
- In the Add Panels window, select the newly created visualization.
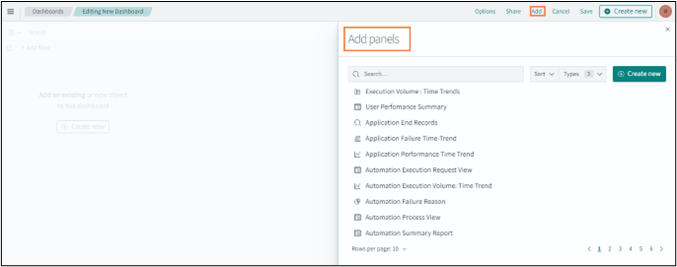
- A success message appears as Visualization was added to your dashboard on the page. Following is the sample of newly created visualization added to the dashboard.
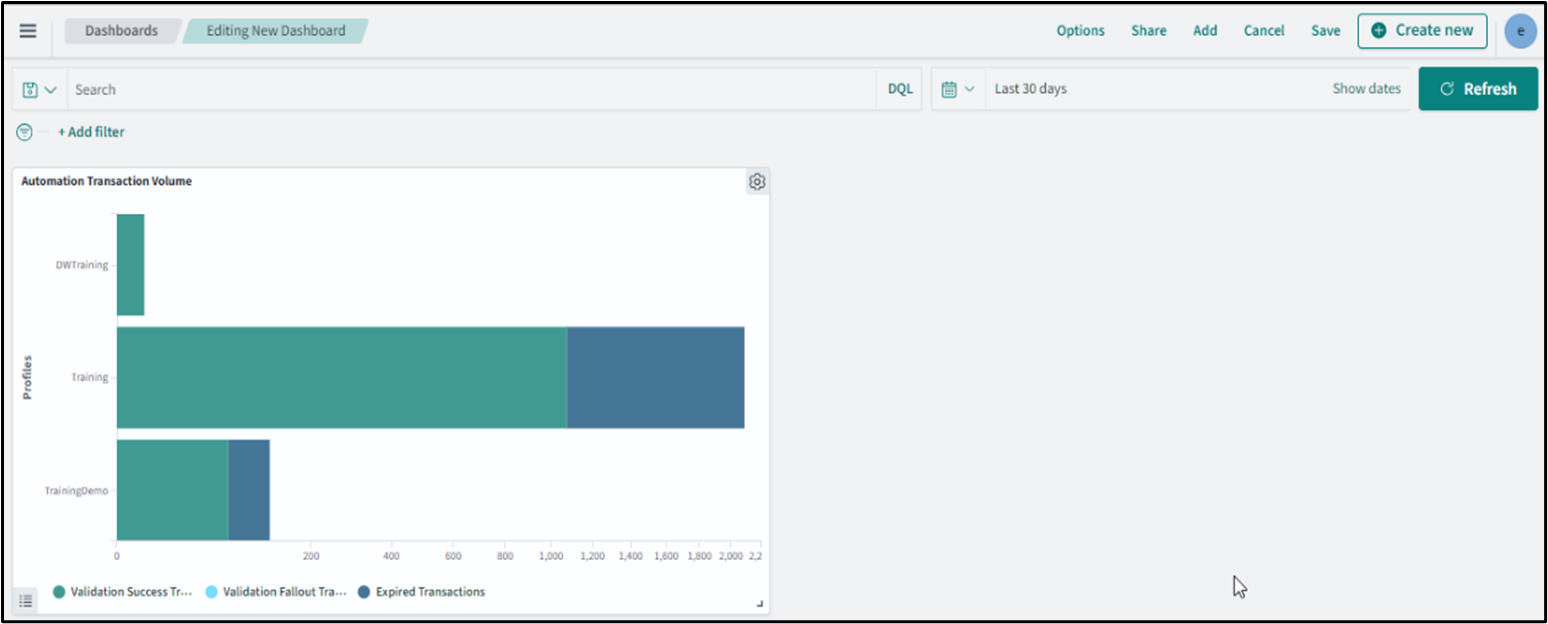
- Additionally, you can add visualizations to the dashboard following the same process, as per your preferences.
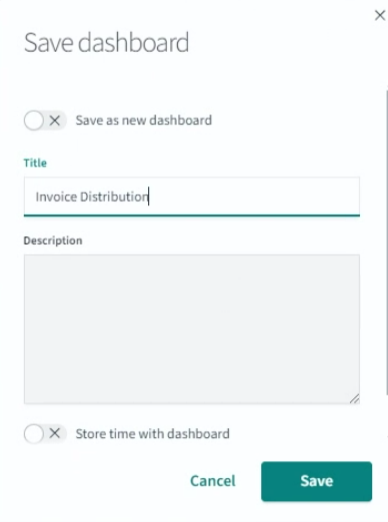
- Once, you finish editing the dashboard, click Save.
The Save dashboard window is displayed.- In Title field, specify a name for the dashboard.
- In the Description text box, enter the description about dashboard, if required.
- Then, click Save.
The new dashboard is saved. Additionally, new created dashboard is added on the main dashboard page from where you can directly access the customized dashboard.
Following is a sample page showing a newly created dashboard.
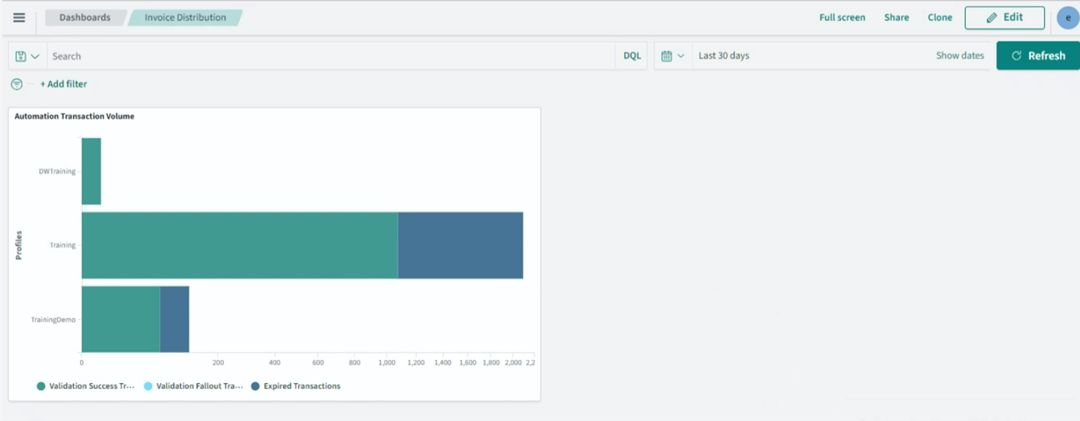
The new dashboard is created successfully.
|
NOTE: |
Once Dashboard is created it needs to be given access using Admin Module. For more information, see Specify role access. |