Creating New or Custom Dashboard
AE RPA SaaS enables you to create new or custom Dashboard for the default reports as well as for the visualizations created using datareport index. Using these dashboards, you can view the data at glance into details. You can view and edit the data to find out the data to displays on dashboard as per your preference.
Prerequisites
Before starting, ensure that you have done following:
- Reporting component should be in running state.
- Logged-in tenant should have relevant access to reporting page and concerned tabs such as Visualization, Management and so on.
Before Starting with Creating New or Custom Dashboard
To get started with creating new or customizing dashboard, you require following:
- Data indexed into OpenSearch.
- A default Index pattern (<TenantName>_rpa-trans-*, <TenantName>_rpa-txn-steps-*, <TenantName>_component_name) must already be present to retrieve the data from OpenSearch. It enables you to create new or custom Dashboard for OOB reports.
- The custom datareport index created to retrieve the data from Elasticsearch. This enables you to create custom Dashboard for the custom reports. For more information about creating Index pattern, see Creating_an_Index_Patterns.
- At least one saved visualization created using the. For more information about creating visualization, see Creating_Visualization.
NOTE:
User who possess edit access only can create or edit the dashboard. For more information about edit option in Reporting, see Specify role access.
Creating New or Custom Dashboard
When you click the Dashboard tab for the first time, the OOB Dashboards are displayed. Here, you can build a new dashboard or custom dashboard as per your preference by adding visualizations.
To create a new dashboard:
- Navigate to Dashboard > Create dashboard. The Create dashboard page is displayed.
- At the top right corner or on the dashboard page, click Add. It displays the list of newly created visualization.
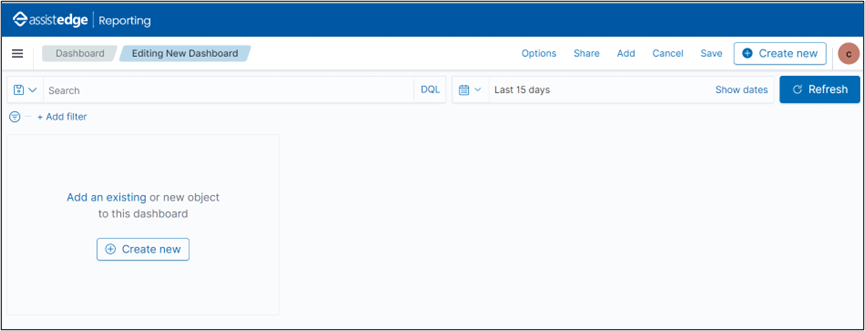
- At the top corner, you can find options such as Save, Cancel, Add, Options, Share, Auto-refresh and also change the time to get the data on the dashboard.
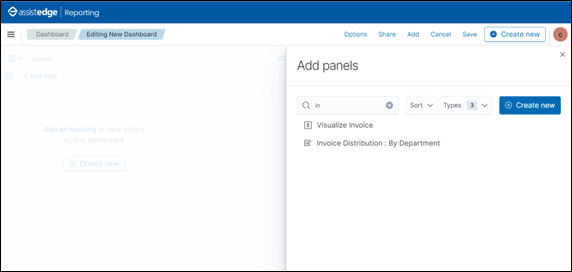
- In the Add Panels window, select the newly created visualization.
- A success message appears after the visualization is added. Following is the sample the of newly created visualization added to the dashboard.
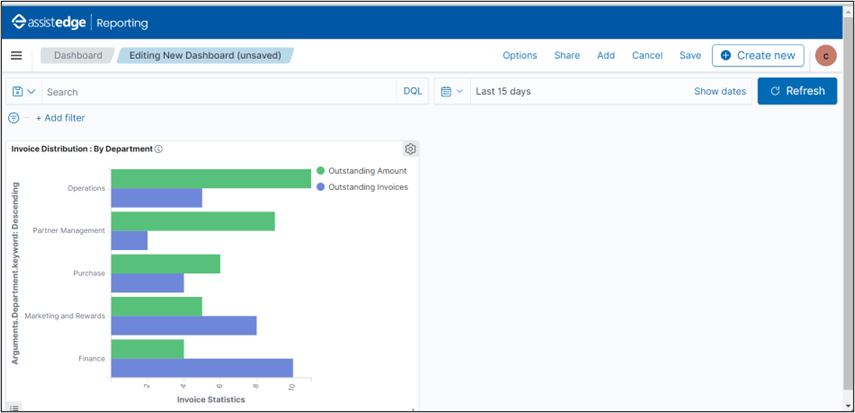
- Additionally, at this point in time you can add visualizations to the dashboard following the same process, as per your preferences.
- Once, you finish editing the dashboard, click Save.
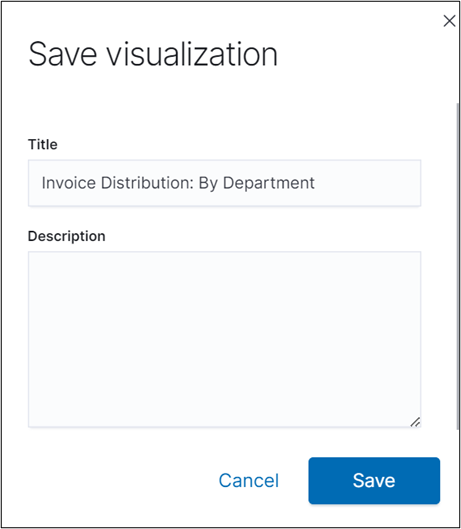
The Save dashboard window is displayed.- In Title field, specify a name for the dashboard.
- In the Description text box, enter the description about dashboard, if required.
- Click Save.
NOTE:
Once the Dashboard is created it needs to be given access using the Dashboard Access option available in the Admin Module. For more information, see Specify role access.
The new dashboard is saved and is added to the main Dashboard page from where you can directly access the customized dashboard.
Following is a sample page showing a newly created dashboard.
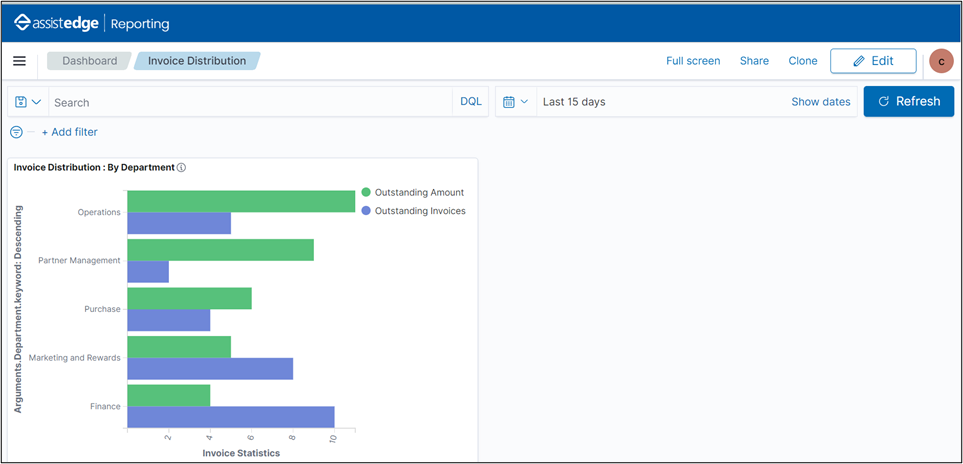
The new dashboard is created successfully.