AssistEdge Reporting
Dashboard Displays Warning
- While accessing the reports or the dashboard, if OpenSearch dashboard displays a warning like “x of y shards failed.”, then it is a warning message saying to show visualization/dashboard required field data is not present in x number of index of Txnstore. So, Kibana will show visualization/dashboard just for (y-x) index’s data.
- This will happen mostly when you have old index data in Txnstore. After that you are adding new fields, creating reports using that field and you forgot to add mappings for that new field in old indexes.
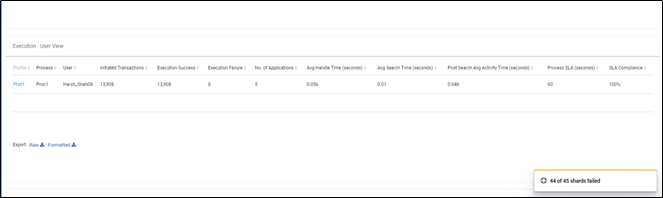
- If the user wants to see all index data and does not want to see the warning message, then add the required fields mappings in templates and for older indexes.
- To add field mapping in the Txnstore index, run one ‘PUT’ command in Txnstore.
COMMAND: PUT /index/_mapping
JSON INPUT:
{
"properties": {
// instead of custom_field add field with appropriate type which field’s mapping is missing in index.
"custom_field": {
"type": "keyword"
}
}
}
- To add field mapping in the Txnstore index, run one ‘PUT’ command in Txnstore.
Able to View Only One Process Report
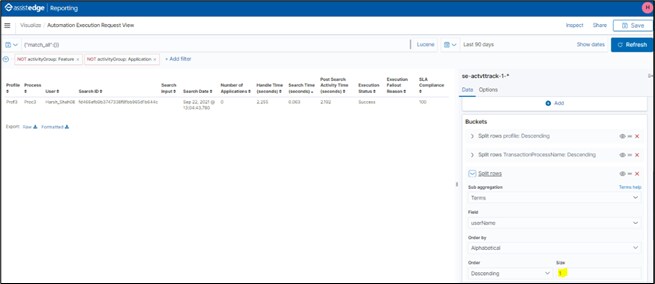
- By default, we group rows in reports/visualizations by size, for example, we show top 1 profiles and top 1 processes against the profile in the OOB Report. If there are more than 1 process for a given profile, then we are showing the top 1 process. If users want to see more processes, then the user can go to the individual visualization and change the size to view more records.
- This behavior is applicable for all the reports in which we are grouping rows based on terms, like, Robots, Profile, Process, Transaction Id, etc.
Refer to the below snapshot to configure the size of the rows:
AssistEdge Reporting Logo Not Directing to Dashboard
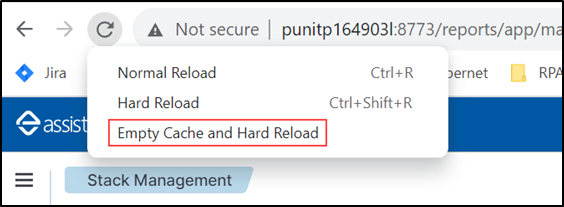
If, after installing the SP1 patch, you click on the AE Reporting logo on the Reporting page and are not directed to the dashboard page, perform the following actions:
- Open the Reporting page in a new tab.
- Right-click on the Reporting page and select Inspect, to open the developer console.
- Click and hold the Refresh
 icon.
icon. - Select the Empty Cache and Hard Reload option from the dropdown.