TxnStore Performance
Txnstore Performance provides a statistics page that enables you to view the performance statistics for the service operation that flows through elasticsearch.
On the APM Dashboard > click TXNSTORE PERFORMANCE tab to view the performance statistics.
TxnStore Performace dashboard provides the following information:
Cluster details
A cluster is made up of one or more nodes. Cluster details displays the details such as total nodes, total indices, total documents and so on.
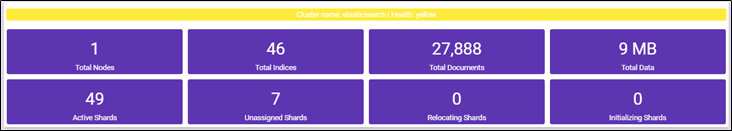
Following field description table contains information about cluster details:
|
Cluster Details |
Description |
|
Cluster Name |
Indicates the name of the TxnStore (elasticsearch) cluster. |
|
Health |
Indicates the health of the cluster, status can be one of the following:
|
|
Total Nodes |
Displays the total number of nodes (machines) where elasticsearch is installed. |
|
Total Indices |
Displays the total number of indexes created (Indices are like to databases in RDMS term). |
|
Total Documents |
Displays the total number of documents (records) that are created. |
|
Total Data |
Displays the total size of data that is created in elasticsearch. |
|
Active Shards |
Displays the total number of active shards. Shards are logical separation of data (shards like tables in terms of RDBMS) |
|
Unassigned Shards |
Displays the total unassigned shards. If some of the nodes (machines) are unreachable in cluster, then data (shards) of those machines become unreachable and shards remains in unassign state. |
|
Relocating Shards |
As elasticsearch internal moves, copies or replicates the data between nodes (elasticsearch servers) then this represents the relocated data. |
|
Initializing Shards |
Indicates that the data is loading. |
TxnStore System Details
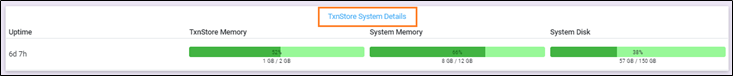
Following field description table contains information about TxnStore System details:
|
TxnStore System details |
Description |
|
Uptime |
Displays the up and running time of cluster. |
|
TxnStore Memory |
Displays the total available and used memory by elasticsearch. |
|
System Memory |
Displays the total available and used system memory of all elasticsearch cluster nodes. |
|
System Disk |
Displays the total system disk space available for elasticsearch nodes to store the data. |
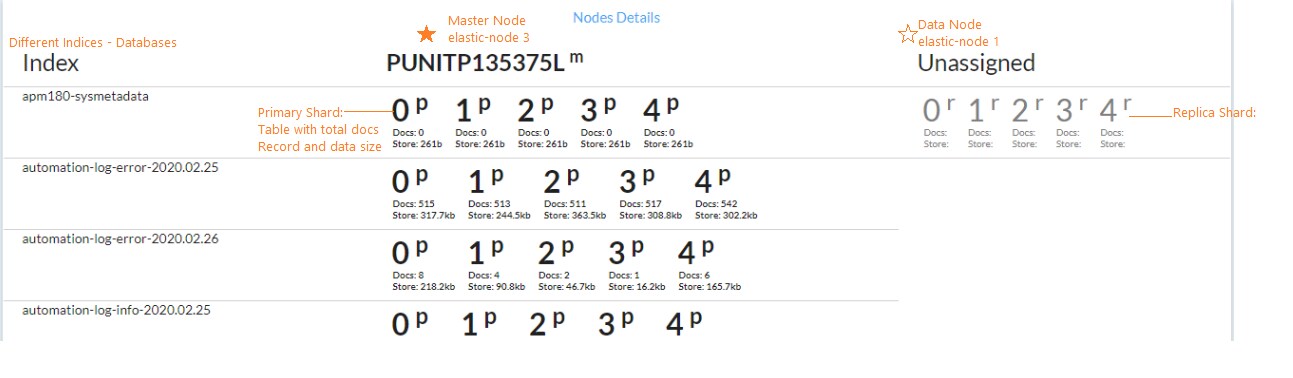
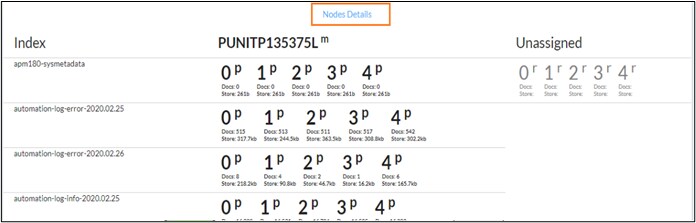
Nodes Details
Whenever you are starting the elasticsearch instance, you are actually starting the nodes. The Nodes details provides information about the nodes in which the data resides. Additionally, it displays information about the node whether it is available or unassigned.
Following field description table contains information about nodes:
|
Nodes details |
Description |
|
Index |
Indicates the databases of elasticsearch . |
|
m |
Indicates the master node and it will be in bold font. |
|
d |
Indicates the data node. |
|
Other columns specifics different nodes |
|