Messaging Performance Statistics
Messaging Performance Statistics provides a statistics page that enables you to view the performance statistics for the service operation that flows through RabbitMQ. Messaging (RabbitMQ) is a message broker which accepts and forwards the messages.
On the APM Dashboard > click MESSAGING PERFORMANCE tab to view the messaging performance statistics.
Messaging Performance Statistics dashboard provides following information:
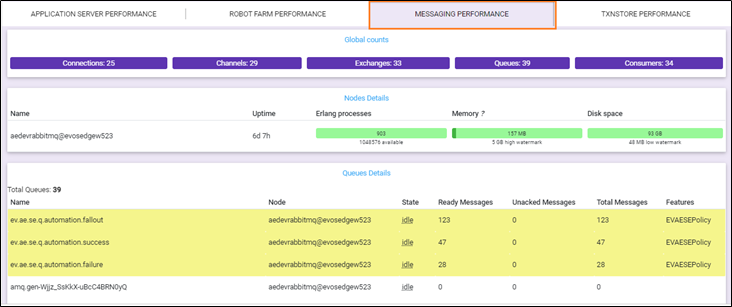
Global Counts
Global Counts displays the details such as connections, channels, exchanges and so on with the rabbitmq.

Following is field description of the global counts details:
|
Global Counts details |
Description |
|
Connections |
Displays the total number of connections to RabbitMQ servers. Usually product components control tower, Logstash, agents and robots connect to the RabbitMQ server. Usually be default around 10 connections will be present. Other connecting will be established based on number of agents and robot deployed. |
|
Channels |
Once connection is established consumer may or may not create channel. Channel is usually created to publish (to send data) or subscribed (to receive data) from RabbitMQ server. |
|
Exchanges |
Exchanges routes messages (automation requests, various commands from control tower and so on.) based on arguments containing headers and optional values. |
|
Queues |
Stores messages that are used by the applications. |
|
Consumers |
Various applications/components that are connected to send/receive data from RabbitMQ server. |
Nodes Details
Nodes details displays the RabbitMQ server cluster statistics.
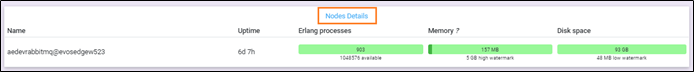
Following is field description of the nodes:
|
Nodes details |
Description |
|
Name |
Displays the name of node in the cluster. |
|
Uptime |
Displays the time for which the node is up and running. |
|
Erlang processes |
Displays the number of erlanng processes opened by RabbitMQ server. On hovering a mouse over erlanng, you can view following information:
|
|
Memory |
Displays the memory used by RabbitMQ server. |
|
Disk space |
Displays the total disk space available on the server where RabbitMQ is installed. |
Queues Details
Queues details displays the total different number of queues created or being used in product. Additionally, displays the total queues count at the top.
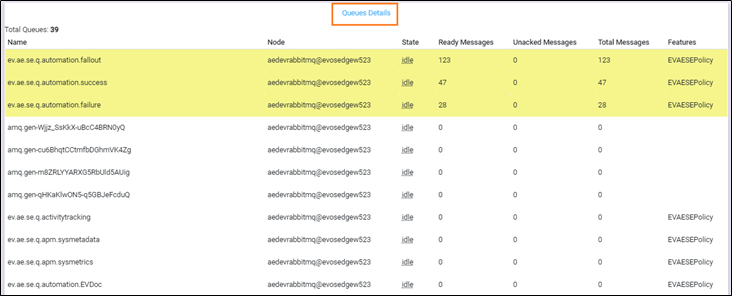
Following field description table contains information about queues:
|
Queues details |
Description |
|
Name |
Displays the name of the queue. |
|
State |
Displays the state of queue, which can be either,
|
|
Ready Messages |
Displays the number of messages that are present in queues and ready for consumer (ideally robots) to consume and act upon. |
|
Unacked Messages |
Displays the number of message that are in Unacknowledged state. Unacknowledged means messages are consumed by consumer (ideally agents or robots) but acknowledgement about the message processing is not yet received. |
|
Total Messages |
Displays the total number of message in ready and un-ack state. |
|
Features |
Displays the different features of queues such as policies if applied. |