APM (Application Performance Monitoring) Dashboard
APM (Application Performance Monitoring) is about generating bird’s-eye-view dashboard and metrics of the different servers and applications. APM dashboard monitors the performance metrics of business-critical servers and applications.
APM Dashboard enables you to do following:
- To view and filter different reports for periodic performance analysis for different diagnostics solutions.
- Provides actionable insights to the data, so that you can quickly drill down to root cause of application problems.
Prerequisites
- By default only the <Super_Admin> and < Admin> role has access to APM Dashboard. For more information about APM access, see Specify Role access section in the Administrator.
- Ensure that the logged-in user role has page access to view the APM Dashboard. If user, do not have page access assigned, then user will not be able to see the APM Dashboard Tab in the control tower. To assign the page access to user, see Page Access section in Administrator.
Before accessing the APM Dashboard
Before accessing the APM Dashboard, you are required to do following configuration.
Data Capture Configuration
Control Tower APM Dashboard displays the data captured by APMClient. APMClient is data capture utility which capture system and components (RPA components) level data for APM dashboard.
This data capture utility is available for both at server-side components and at client-side components for data capture.
Following table explains about the relevant data capture configuration:
| Configuration | Description |
| At Server side |
|
|
At Client side |
|
|
NOTE: |
Ensure that you copy the Proctor and Agent folder with the APMClient folder. These folders must be at the parallel location. |
Updating Server-side Data Capture Configurations
To update configurations for server-side data capture:
- Navigate to - $\AssistEdge Automation\scripts\ae.properties and open the configuration file in edit mode to update the server-side data capture.
- For Server-side configuration, you must enter the key and value after the mentioned equal to format.
- You can add parameters at the server side. In case you want to add parameter in server-side, then you must perform following configuration in the ae.properties file. For more information about the data capture parameters, see Updating Client-side Data Capture Configurations.
- By default, only APM_DataCapture_Enable parameter is present in ae.properties file.

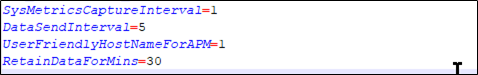
- As per your requirement, you can add other parameters in ae.properties file such as SysMetricsCaptureINterval, DataSendINterval, UserFriendlyHostNameForAPM, and RetainDataForMins as shown in below image.
Updating Client-side Data Capture Configurations
To update configuration for client-side data capture:
- Open $\APMClient\APMClient.exe.config configuration file in edit mode to update the client-side data capture.
NOTE:
As APMClient is available at two places as mentioned above, you would need to edit respective APMClient.exe.config configuration file for update.
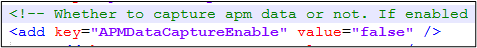
- Enable/Disable Data Capture: Edit APMDataCaptureEnable configuration key. Set value to true to enable data capture and set to false to disable data capture.
- Change Data Capture Interval: Edit SysMetricsCaptureInterval configuration key. Set value in minutes to capture data at particular interval. Minimum value should be 1 minute. Maximum threshold value is 59 minutes. If the set value is lower than minimum value or higher than maximum value then, default 1-minute value will be considered.

- Data Send Interval: Edit DataSendInterval configuration key value. Set value in minutes to send data to server at particular interval. DataSendInterval must be in multiple of SysMetricsCaptureInterval. For example, if data capture interval is 2 minutes then, data send interval can be either 2 minutes, 4minutes, 6minutes and so on. If the interval is not set in multiple of SysMetricsCaptureInterval then, default 5 multiples of SysMetricsCaptureInterval will be used.

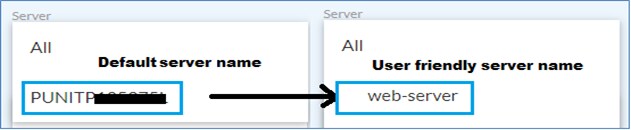
- Configure Server User-friendly Names: APMClient by default, captures system DNS (hostname) name as server name and same will be visible at Control Tower APM Dashboard in server list and at all graph data, if you want to give user-friendly name then update following configuration.
- Edit UserFriendlyHostNameForAPM configuration key. Specify the user- friendly server name that you want to see in Control Tower APM Dashboard.
![]()
For example, the following screen shows user-friendly name which in turn will be available at Control Tower APM Dashboard server list drop down and charts.
- Data retain configuration:
APMClient by default retains data locally in file system for last 30 minutes in case of dis-connectivity with messaging (rabbitmq) server. Once connection is re-established, it pushes data stored/retained locally. Edit RetainDataForMins configuration key. If RetainDataForMins is lower than DataSendInterval then, RetainDataForMins value will be set as DataSendInterval value. For example, If RetainDataForMins=5 and DataSendInterval =10 then, RetainDataForMins will be set as 10. For instance, RetainDataForMins=10.

- Stop data capture in case of inactivity:
At server side APMClient gets closed once all the server processes/components are closed and data capture stops. At client side APMClient closes after 10 minutes (default) of inactivity of Agents and Proctors after close. Edit StopDataCaptureAfterMissedInterval configuration key and provide appropriate time interval. APMClient closes after configured interval data is missed.
Configuring Data Capture for APM Dashboard
APM data is captured at all RPA configured servers and stored in elasticsearch. APM dashboard data are retrieved from these data. APM data is captured (if enabled) at configured interval (default is 1 minute) and aggregated (as performed by elastic search) in dashboard chart view based on time duration selected.
For more information about how average aggregation is performed by elastic search, see https://www.elastic.co/guide/en/elasticsearch/reference/6.7/search-aggregations-metrics-avg-aggregation.html
For more information about detailed data capture configuration, see Data Capture Configuration.
|
NOTE: |
APM Dashboard displays the data for maximum last 30 days. |
APM Data Store Configuration
APM Dashboard shows the data for maximum last 30 days. APM dashboard data is stored in TxnStore (elasticsearch) for at maximum last 30 days. Data more than 30 days (default) will be purged automatically. To retain the data for more than 30 days, update the vanguard configuration accordingly.
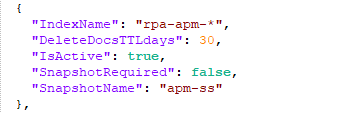
Navigate to $\app\Vanguard\appsettings.json location and open the file. In ESIndexDataDeletionSettings section > “IndexName”: “rpa-apm-*”, update the value for “DeleteDocsTTLdays” to number of days you want to keep APM data in TxnStore index.
|
NOTE: |
IsActive: true indicates that the data will get deleted after the specified number of days. |
Once the configuration is done, you can start accessing the APM Dashboard.