View Logs in Kibana
Kibana provides a front-end design to work with Elasticsearch. Functionality to push logs (for example AssistEdge_SE.log) to Elasticsearch for Robots and RPA Listener is added. RPA Admin module enables you to view the logs in Kibana.
Note that these logs are not limited to only automation steps. This logs all the activities performed by Robots or RPA Listener and categorize them in three levels - Error, Warning and Info. Categorizing the logs in three different levels helps you while debugging the component.
Following are the three levels of logs you can push to Elasticsearch:
- Error: It push only error logs. For example, all records of AssistEdge_SE.log file with "level":"Error" will be pushed into Index automation-log-error-{DATE}.
- Warning: It will push warning and error logs. Indexes automation-log-warn-{DATE} and automation-log-error-{DATE} is created and respective logs are pushed into these indices.
- Info: It will push information, warning and error logs. Indexes automation-log-info-{DATE}, automation-log-warn-{DATE} and automation-log-error-{DATE} are created and respective logs are pushed into these indices.
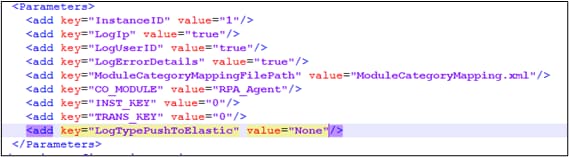
By default, this feature is disabled and LogTypePushToElastic is set to None. This setting will not push logs to Elasticsearch, and index is not created.
To enable the feature update LogTypePushToElastic to Info, Warn or Error. To enable we have to change the settings by making changes to <Robot Installation Path>\RobotAgent\Robots\ {ROBOT_NAME} \RoboSE.exe.config file for Robots in the following sections:
For RPA Listener, make changes in <AssistEdge Installation Path>\app\RPA-Listener\config\config.yml file.
After configuring the settings, you can run Robots (and RPA Listener) to generate logs.
Note that while doing the changes, RPA-Listener and Robot should be in stopped state.
Once the logs are generated and indexes are created, you can view the logs in Kibana.
For viewing logs in Kibana, add the index automation-log-* and choose @timestamp in Time Filter field name.
|
NOTE: |
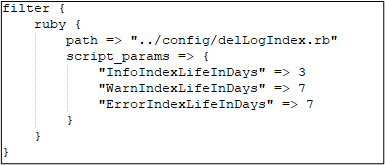
Since large amount of data may be generated, the indexes will automatically delete after a specified duration. By default, log index will be deleted as per below configuration. |
- automation-log-error-{DATE}: 7 days
- automation-log-warn-{DATE}: 7 days
- automation-log-info-{DATE}: 3 days
However, you can change the settings by making changes to <Installation Path>\runtime\generic\logstash\logstash-6.7.2\config\rpa\delLogIndex.conf file in the following sections:
Cron job is running to delete above mentioned index at night 12:00 AM local time zone. However, you can change the settings by making changes to <Installation Path>\runtime\generic\logstash\logstash-6.7.2\config\rpa\delLogIndex.conf file in the following sections:
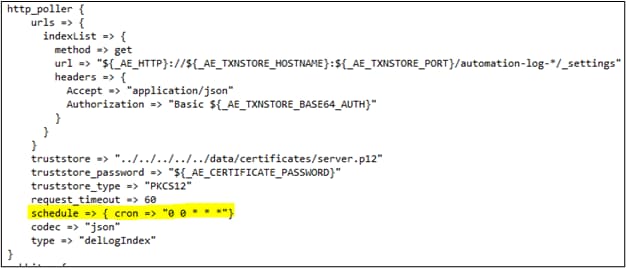
After configuring the settings, you can run Logstash. Ensure that, while doing these changes, Logstash is in stopped state.