Process View
The process view panel displays the summarized status of all the transactions related to the processes running across all the robots. This panel provides following information:
- The last seven day’s transaction statistics for each process as per user’s access.
- Process View panel on dashboard displays only five processes at a time.
Starting with Process View
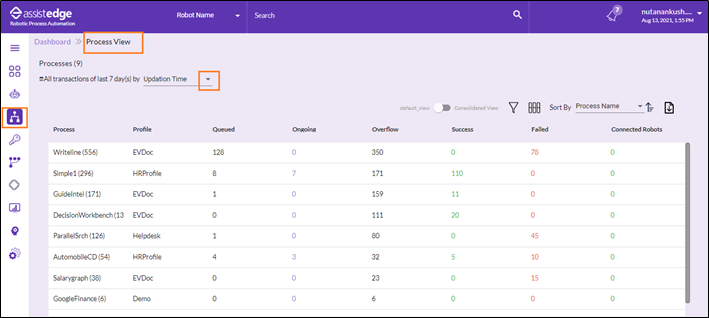
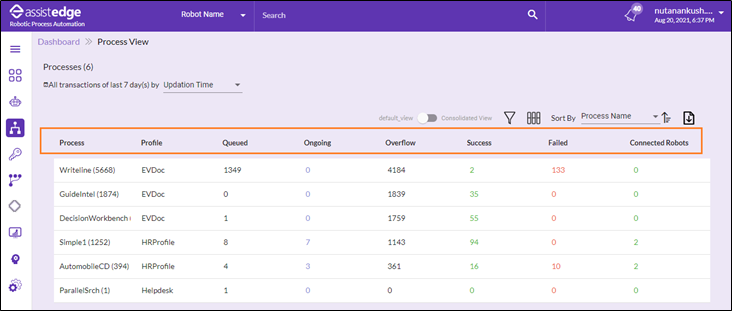
Process View page enables you to view a complete list of process available along with the additional columns such as Profile, Queued, Ongoing Transaction and so on.
Process View shows all the last seven days transactions according to updated time or created date. From the All Transactions of last 7 day (s) by list, select the preferred option such as Updation Time or Creation Time according to which you want to view the details in the process view page.
- Updation Time: The updation time shows the data based on the time in which the transaction is updated. For example, if Transaction has been created prior to 7 days, but has changed its state or updated in last 7days, then that data is displayed.
- Creation Time: The Creation Time shows the transactions created only in last 7 days. For example, if the transactions are created before 7 days, then those transactions will not be displayed.
To start with the process view page:
- Click the
 (Process view) icon.
The Process View page is displayed.
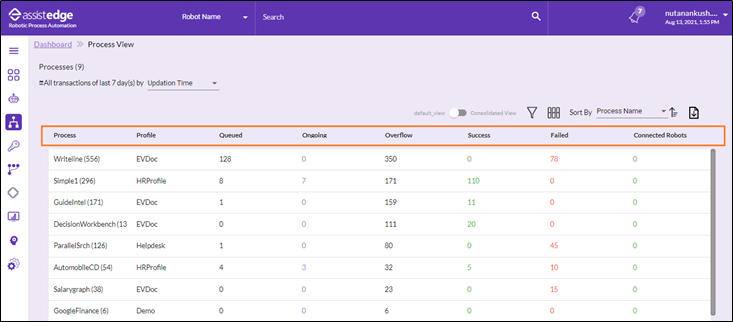
Following is the description of each column:
|
Column Header |
Description |
|
Process |
Displays the name of the process along with the total number of transactions received for the process. |
|
Profile |
Displays the profile mapped to the process. |
|
Queued Transactions |
Displays the queued transactions waiting to be picked up by a robot or transactions being currently processed. |
|
Queue Overflow |
Displays the transactions which are not picked up by the robot because of a failed business validation or the transaction timed out before it was picked. |
|
Ongoing Transactions |
Displays the transactions which are currently being processed by the robots. |
|
Successful Transactions |
Displays the transactions that have been executed successfully. |
|
Failed Transactions |
Displays the requests picked by the robot for execution but could not execute successfully. |
|
Average Validation Time |
Displays the average time taken by the listener to validate the transactions. |
|
Average Wait Time |
Displays the average time for which requests waited in the respective queues. |
|
Average Execution Time |
Displays the average time taken by robots to execute the transactions of the corresponding process. |
|
Average Execution Time (successful transactions) |
Displays the average time taken by robots to successfully execute the transactions of the corresponding process. |
|
Average Handle Time |
Displays the average time taken for the transactions of the corresponding process to be completed. This handle time of a transaction includes validation, wait and execution time. |
|
Average Handle Time (Successful Transactions) |
Displays the average time taken for the transactions of the corresponding process to be completed successfully. This handle time of a transaction includes validation, wait and execution time. |
|
Predicted SLA Expiry |
Displays the number of transactions which are going to meet the SLA Expiry criteria based on the prediction performed by ML. For the ML to perform action, ML component should be ON. Additionally, as per default setting, the prediction will start only after 25 transactions. In order to get this data displayed, SLA time should be defined while deploying the process. |
|
Predicted Transaction Expiry |
Displays the number of transactions which are going to expire based on the prediction performed by ML. |
|
Robots Connected |
Displays the number of the currently connected robots which are ready to execute the transactions for the process or profile. |
- The Process View page enables you to do following:

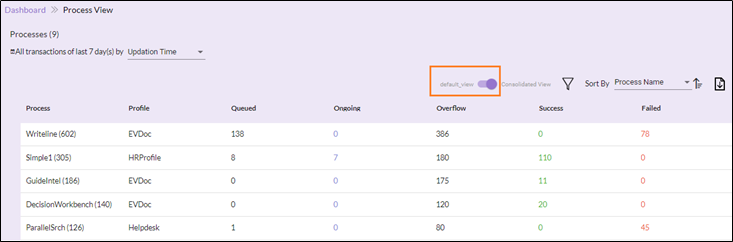
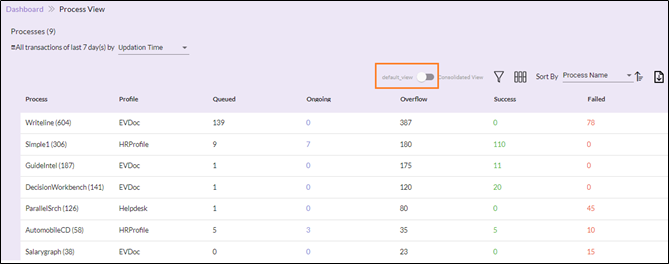
Default View or Consolidated View :
- Click the
 (Toggle) icon to switch between the Default View and Consolidated View.
 - The consolidated view displays the sum of only latest instances and ignore previous instances of retried transactions.
Filter:
- Click the
 ( Filter) icon to view the statistics by the processes or profiles using the search capability in filters.
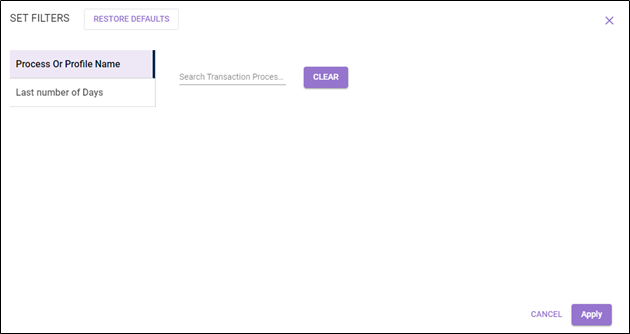
- The SET FILTERS page is displayed.
-
In the left panel, select the preferred filter parameter.
-
In the right panel, specify the required details. Click Clear, if you want to change the details.
-
Then, Click APPLY to view the process view list as per the selected criteria.
-
The result is displayed on the page as per the selected parameter.
-
OR
Click RESTORE DEFAULTS to reset the process filter parameter to default.
Following is the field description of filter:
|
Filter Name |
Description |
|
Process or Profile Name |
Specify the name of process or profile for which you want to apply filter. |
|
Last number of Days |
Specify the number of days for which you want to view the details. |
Select Column for Display:
- Click the
 (Select Columns for Display) icon to view the columns on the process view page.
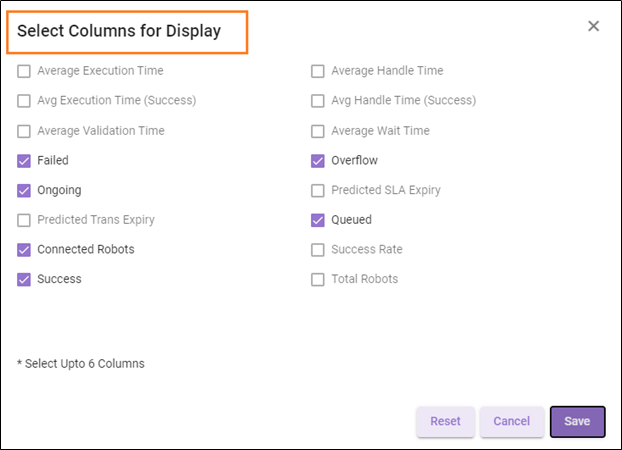
-
Select the check box as per requirement to view the column in the process view. In addition to process and profile filed, you can select only 6 columns at once. For more information about the columns to be displayed, see Process View Column Field Description.
- Click SAVE.
Export as CSV: You can download the reports with current fields details or with all the fields of process view.
- Click the
 (Export as CSV) icon.
 - Select the required option from the available list such as Current fields or All fields to download the report with all fields.
- According to selected criteria, Transactions Report.xls is downloaded on your system.
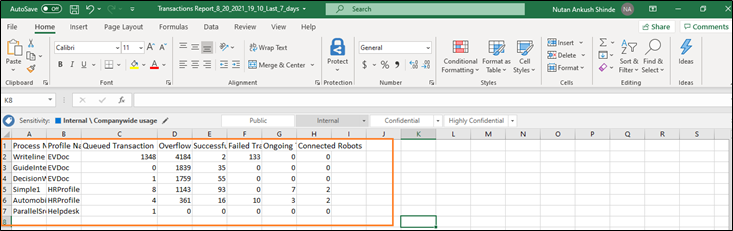
The above shown is a sample transactions report.xls.
Sort By: In the Sort by list, select the preferred option. Additionally, you can sort the available list as per the available sorting criteria such as:- Process
- Process Type
- Profile
- Connected Robots
- Queued
- Overflow
- Success
- Failed
- Average Execution Time (AET)
For more information about the sorting criteria option, see process view Column Field Description.  (Ascending) or
  (Descending) order: Click the or icon to arrange the process view transactions in ascending or descending order.
- In any of the status columns, click on the number of transactions such as Queued, Ongoing Transactions, Success and so on to view the corresponding list of transactions.
The Process View - Transactions View page is displayed.