The Status Bar
In the Status bar, you can view status and other stats of the process you executed along with the errors, if any.
The stats available can help the configurator to understand the CPU and memory utilization during the execution of the process. The configurator can also track the time taken by the steps involved in the process without actually deploying the process to a bot.

The Process Analysis Console
It lists the potential errors that might occur at the time of process execution. This analysis is done only for the enabled rules available in the Rules tab of Admin menu.
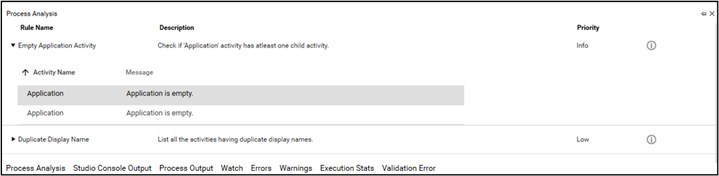
Click Analyse in the Tool Bar menu to generate and view the analysis result in the Process Analysis tab. It displays the name of the rule, the related rule description and the priority of the rule that might occur. You can expand the rule and see the activities that violate the rules. Double click the activity to navigate to the corresponding activity in the Flowchart designer area.
Use the  (More Info) option to know about the rule in details such as the recommendation, failure and expected scenario.
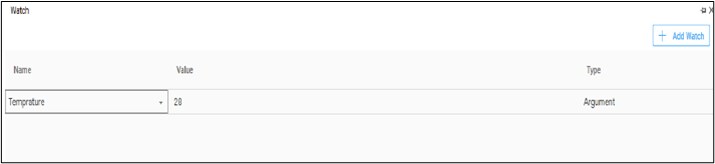
The Watch Console
It allows you to add argument or variable to track the changes in the value assigned while debugging the process.
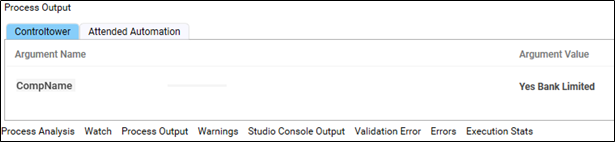
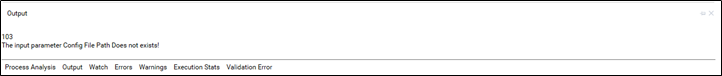
The Process Output Console
The console where you can view the parameters and the associated values marked for display in the Control Tower or Attended Automation. If you want to view the data visible in the Control Tower/Attended Automation you can test run the required process in Automation Studio and view the data in the Process Output console.
The Studio Console Output
The console of Automaton Studio where you can view the output.
The Warnings Console
The console where you can view details about unexpected behavior of the process, if any. Warning provides a message related to possible future issue. These warning messages are shown for the applications which use any of the components covered by prerequisite checker even if the application has been imported or recorded by the PbE.
The console shows up when the environment is set or the application is run.

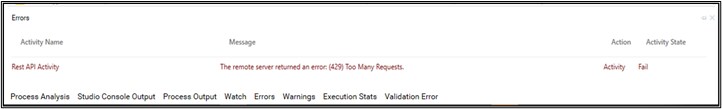
The Error Console
The console where you can view details of the error that might occur during testing. It provides quick issue identification during process configuration and execution.
The Execution Stats Console
It provides an overview process execution. After a process is executed in Automation Studio, details of the workflow along with all the nodes involved can be viewed in this pane. Additionally, you can view:
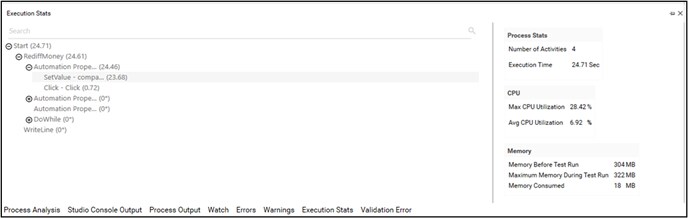
- Process Stats - Displays the total number of activities involved in the process and the total time taken to complete the last execution cycle. In the process outline, available on the left side of the pane provides the break-up of time taken by each activity in the process.
- CPU Utilization - Displays the maximum and average CPU utilization in the last test run.
- Memory - Displays details related to the memory available before and after the test run. It also displays the total memory consumed during execution. The memory consumed is the difference of the before and after stats of the memory occupied.
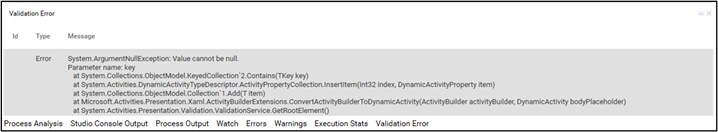
The Validation Error Console
It provides a window to the error that occurs due to validation.