Web Engage Automation Dashboard
Following reports are available in the Engage Automation Dashboard:
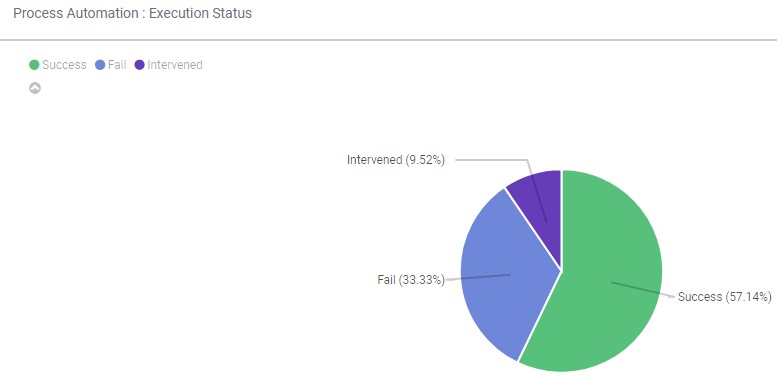
Process Automation : Execution Status
Quick glance view of the percentage of successful, failed and intervened requests in overall automation requests is shown which can be used to analyze the performance of the automation program.
Following table provides the report fields description.
|
Process Automation: Execution Status |
|
|
Field Name |
Description |
|
Success |
Indicates the percentage of successful automations. |
|
Fail |
Indicates the percentage of failed automations. |
|
Intervened |
Indicates the percentage of intervened automations. |
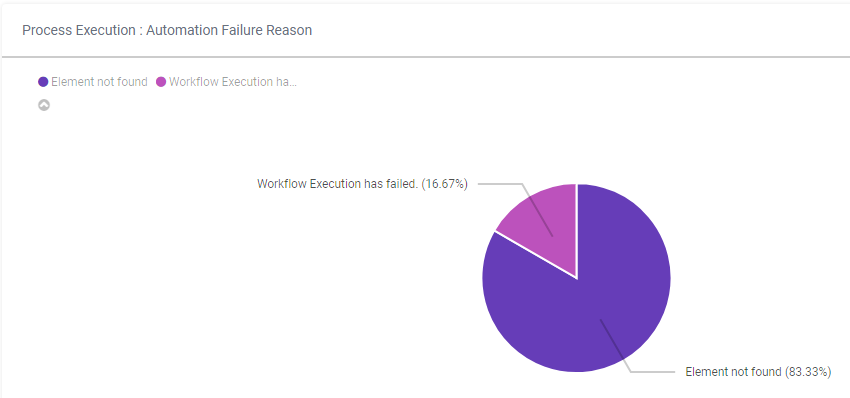
Automation Failure Reason
This report displays the percentage of the failed transactions for each application. This gives an insight on reasons of failure based on their relative contribution improving the performance and quality of automation by addressing key failure reasons.
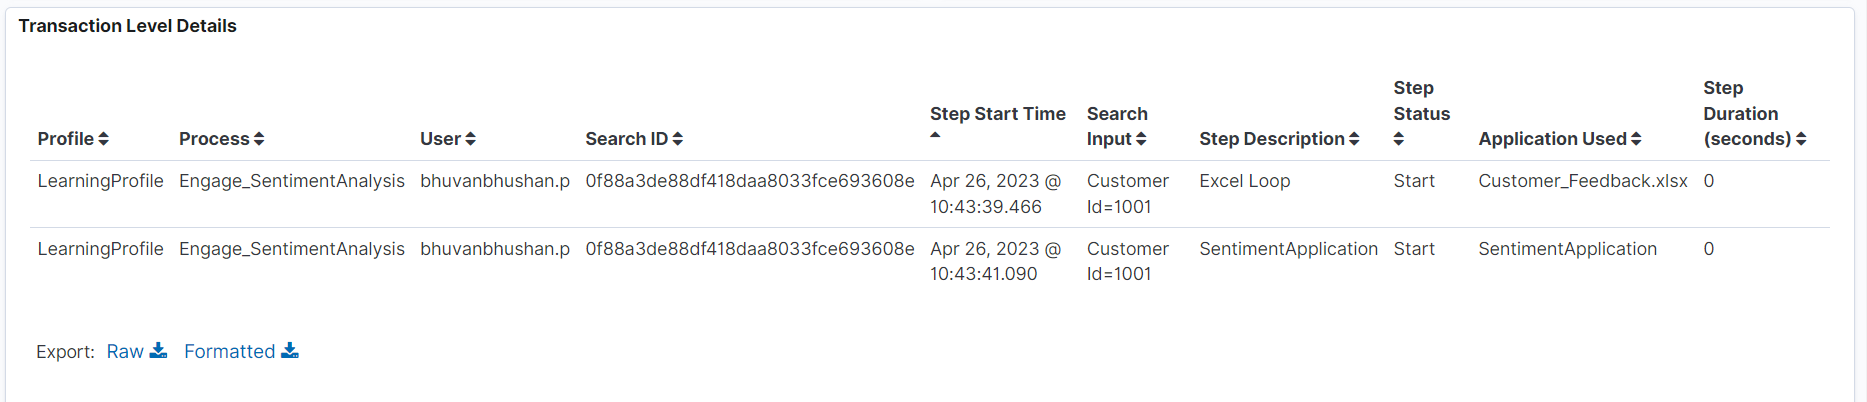
Transaction Level Details
The view displays transactions executed for each profile, time spent in execution and time for other activities.
|
NOTE: |
The data in the report displays only the details about a particular transaction and hence you must filter functionality to extract details for a particular transaction. |
Following table provides the report fields description.
|
Automation Process View |
|
|
Field Name |
Description |
|
Profile |
Indicates the name of the profile. |
|
Process |
Indicates the name of the process. |
|
#Users |
Indicates the total number of users working on the process. |
|
Search ID |
Indicates the search Id of the process. |
|
Step Start Time |
Indicates the start time of the process automation execution. |
|
Search Input |
Indicates the search input of the process automation execution. |
|
Step Description |
Indicates a small description of the process. |
|
Step Status |
Indicates the status of the process. |
|
Application Used |
Indicates the application used in the process. |
|
Step Duration (seconds) |
Indicates the execution duration of the process. |