Insights from Web Engage
The Insights from Web Engage Dashboard enables the Reporting Manager (Role Mapping done in the Admin module) to view the team performance at a higher level.
Following reports are available in the Insights from Web Engage Dashboard:
- Team Productivity Snapshot
- Automation Execution Distribution View
- Team Leader Boards: Top 10 Most Active Users
- Team Leader Boards: Top 10 Least Active Users
- Automation Utilization
- Avg Time on Web Engage
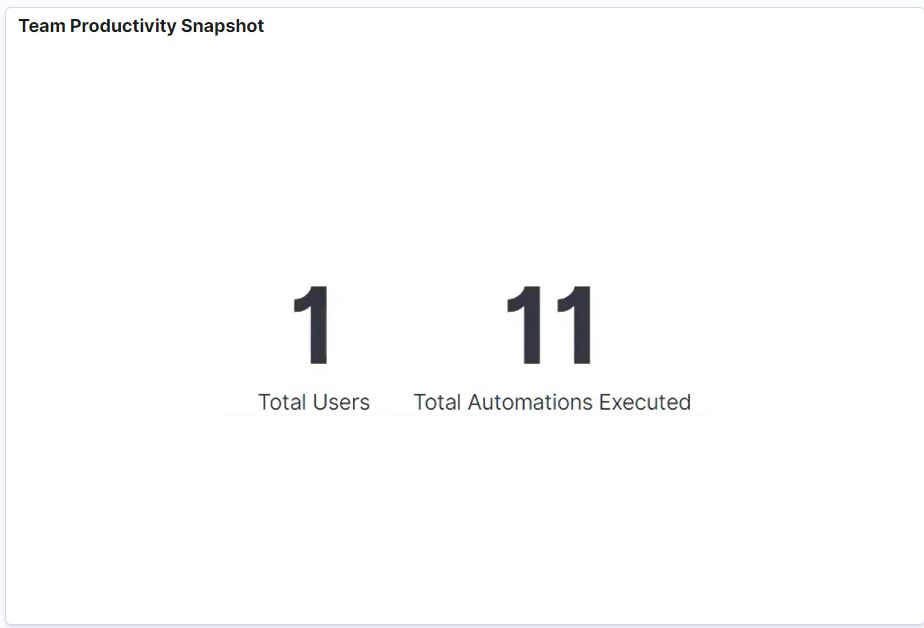
Team Productivity Snapshot
The report provides the insights to the logged in user who is the Reporting Manager of the team working on the Web Engage application:
- The total number of users using the Web Engage application.
- The total number of automations performed using the Web Engage application.
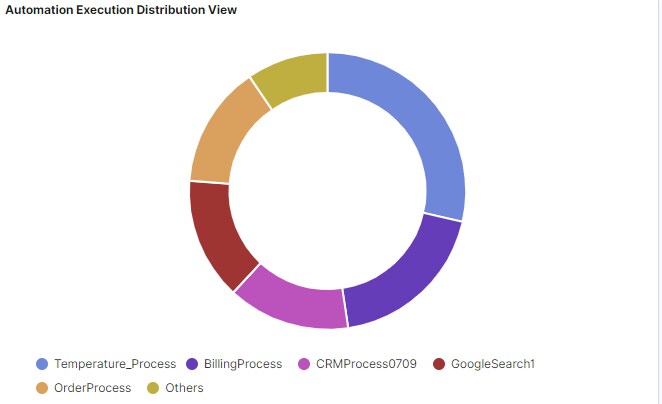
Automation Execution Distribution View
This report provides the insights regarding:
- The total number of executions performed per process. This helps in identifying the most executed processes in the Web Engage application.
- The donut chart displays the distribution of the 5 most executed processes. The remaining processes are clubbed into a group called Others.
Team Leader Boards: Top 10 Most Active Users
This report helps the logged in user, who is the Reporting Manager of the team working on the Web Engage application, know the top 10 most active users of the Web Engage application.
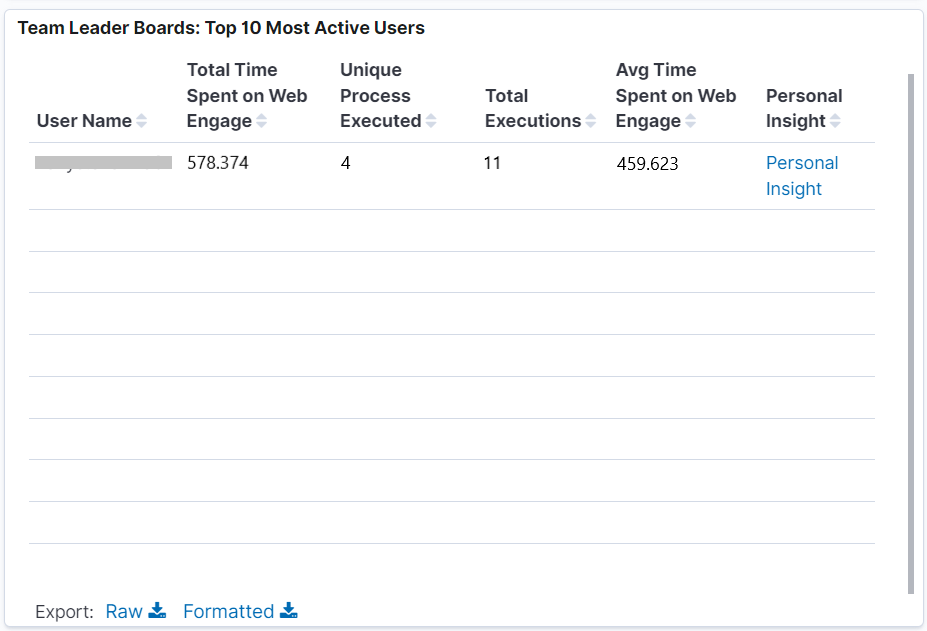
Following table provides the report fields description.
|
Automation Process View |
|
|
Field Name |
Description |
|
User Name |
Indicates the username of the most active users. |
|
Total Time spent on Web Engage |
Indicates the total time spent by each user on the Web Engage application. |
|
Unique Process Executed |
Indicates the total number of unique processes executed by each user. |
|
Total Executions |
Indicates the total number of executions done by each user. |
|
Avg time Spent on Web Engage |
Indicates the average time spent by each user on the Web Engage application. |
|
Personal Insights |
Link to access the user specific data by the Reporting Manager. |
Team Leader Boards: Top 10 Least Active Users
This report helps the logged in user, who is the Reporting Manager of the team working on the Web Engage application, know the top 10 least active users of the Web Engage application.
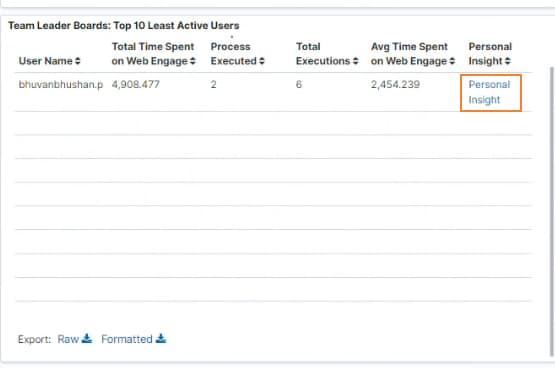
Following table provides the report fields description.
|
Automation Process View |
|
|
Field Name |
Description |
|
User Name |
Indicates the username of the least active users. |
|
Total Time spent on Web Engage |
Indicates the total time spent by each user on the Web Engage application. |
|
Unique Process Executed |
Indicates the total number of unique processes executed by each user. |
|
Total Executions |
Indicates the total number of executions done by each user. |
|
Avg time Spent on Web Engage |
Indicates the average time spent by each user on the Web Engage application. |
|
Personal Insights |
Link to access the user specific data by the Reporting Manager. |
Click the Personal Insights link to view the user specific data such as the total number of executions performed per process and the total number of failed executions.
|
NOTE: |
|
Personal Insights
This Personal Insights Dashboard provides the Reporting Manager a view of the data specific to the user for whom the Personal Insights link is accessed from the Team Leader Boards Dashboard.
|
NOTE: |
Personal Insights Dashboard must be accessed from the Team Leader Boards Dashboard to view the user specific data, else the data is displayed based on the user hierarchy set during Role Mapping at Admin Module. |
Following reports are available in the Personal Insights Dashboard:
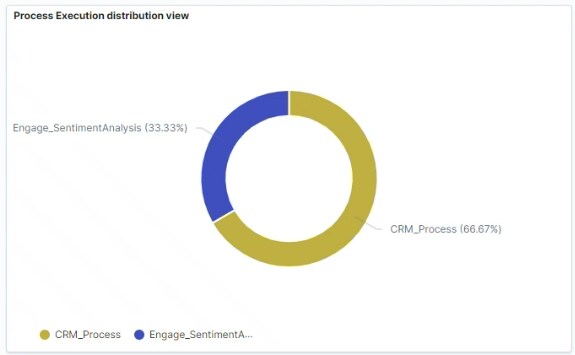
Process Execution distribution View
This report provides the insights regarding:
- The percentage of executions performed per process by the specific user for whom the Personal Insights Dashboard is accessed. This helps in identifying the most executed and least executed processes by the specific user in the Web Engage application.
- The distribution chart is based on the automations executed for the top 5 processes. However, the remaining processes are clubbed into a group called Others.
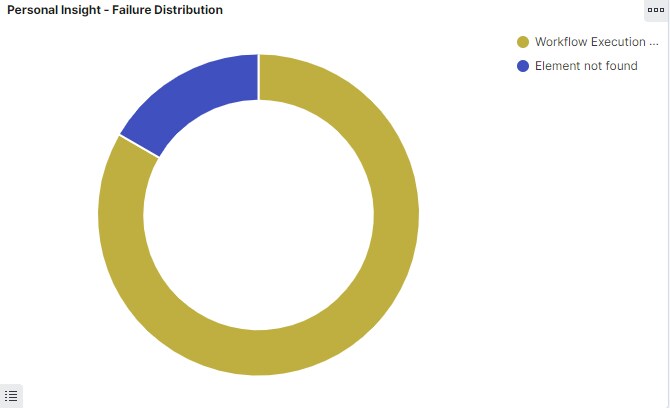
Personal Insight – Failure Distribution
This report displays:
- Failure reasons for the failed processes specific to the users for whom the Personal Insights Dashboard is accessed.
- The distribution chart is based on the occurrence percentage of the top 5 reasons. However, remaining reasons are clubbed under a category called Others.
NOTE:
- The time filter is set to a default value of 1 week and must be adjusted to view information for any other duration.
- You must manually apply the date filter as per your requirement each time you access the Personal Insights Dashboard. The date filter applied to other Dashboards does not get automatically applied to the Personal Insights Dashboard.
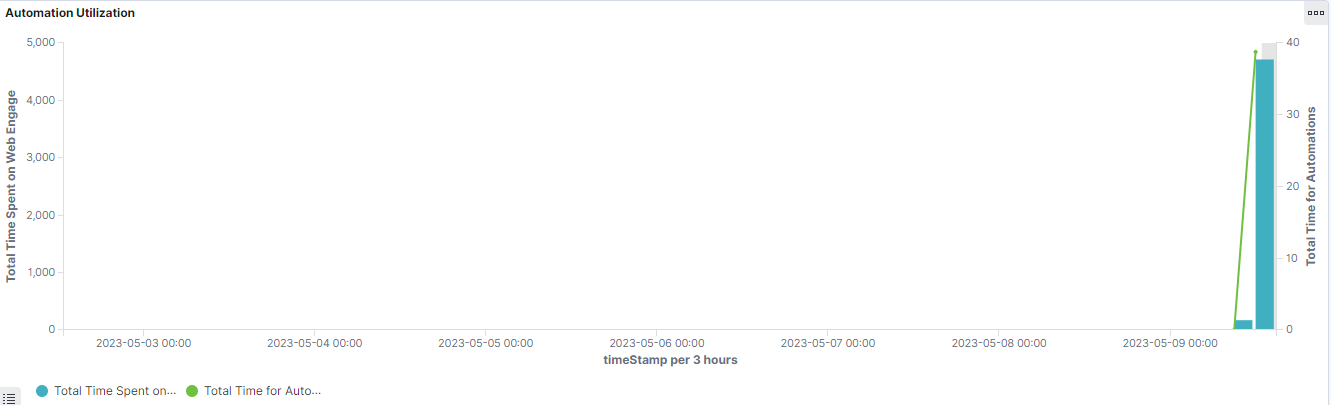
Automation Utilization
This report projects the following information:
- The bar chart represents the total time spent on the Web Engage application collectively by all the users.
- The line chart represents the total time spent for the automation (total summation of the time taken to run an automation).
The report is structured to present the data on date basis.
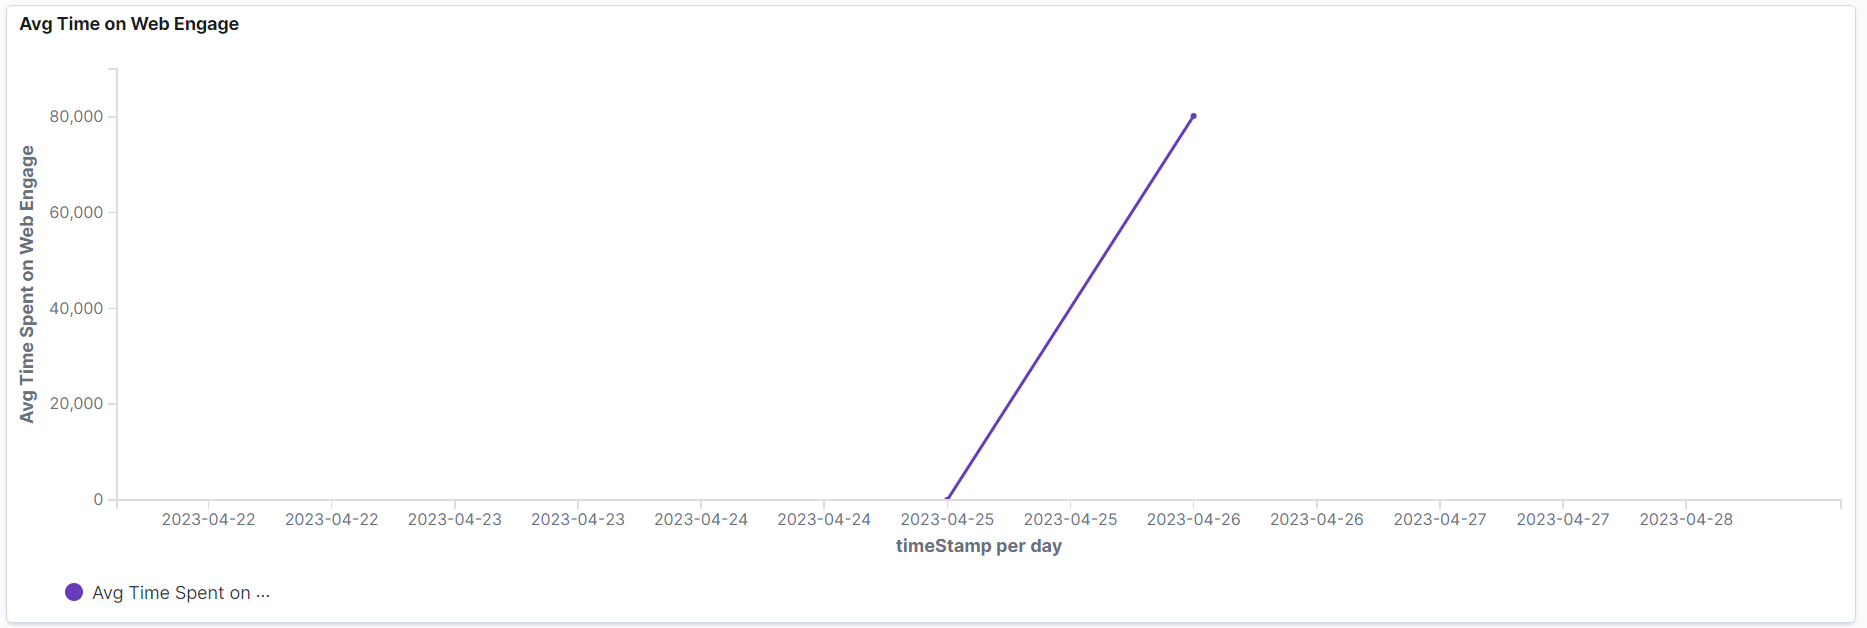
Avg Time on Web Engage
This report indicates the average time spent on the Web Engage application collectively by all the users. Looking at the line graph, the Reporting Manager can conclude if the team is using the Web Engage application or not and for what duration the application is being used. The report is structured to present the data on date basis.