Kibana Reporting
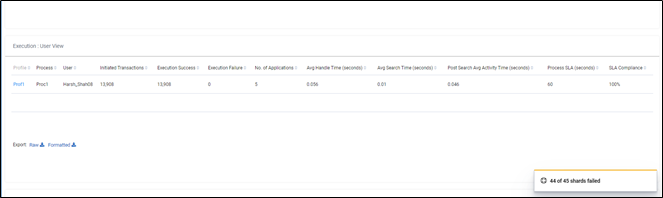
- While accessing Kibana reports/dashboard, if Kibana displays a warning like “x of y shards failed.”, then it is a warning message saying to show visualization/dashboard required field data is not present in x number of index of Txnstore. So, Kibana will show visualization/dashboard just for (y-x) index’s data.
- This will happen mostly when you have old index data in Txnstore. After that you are adding new fields, creates reports with using that field and you forgot to add mappings for that new field in old indexes.
- If the user wants to see all index data and does not want to see the warning message, then add the required fields mappings in templates and for older indexes .
To add field’s mapping in Txnstore index, run one ‘PUT’ command in Txnstore.
COMMAND: PUT /index/_mapping
JSON INPUT:
|
{ "properties": { // instead of custom_field add field with appropriate type which field’s mapping is missing in index. "custom_field": { "type": "keyword" } } } |
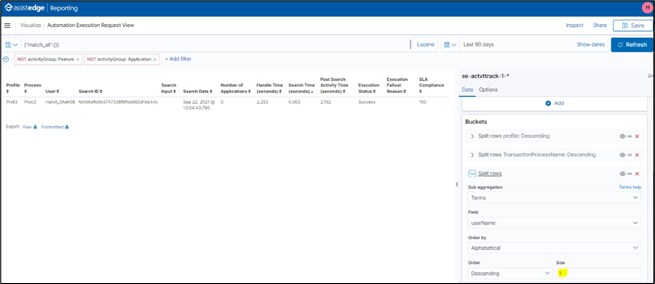
- By default, we group rows in reports/visualizations by size, for example, we show top 1 profiles and top 1 process against the profile in a OOB Report. If there are more than 1 processes for a given profile, then we are showing top 1 process. If user want to see more processes, then user can go to the individual visualization and change the size to view more number of records.
- This behavior is applicable for all the reports in which we are grouping rows on the basis of terms, like, Robots, Profile, Process, Transaction Id, etc. Seeto the below snapshot to configure size of the rows: