Step-By-Step Guide to Use DataTable to Create Datatable of Student’s Marks, Sort the Datatable by Student Name, and Export to Excel
Let us consider creating a data table which comprises of student’s marks and sort the data table by student name and export it to excel. The activities used in this example are Create DataTable, Add Row, Sort DataTable and Export DataTable.
To create a datatable for student’s marks:
- Create a new process.
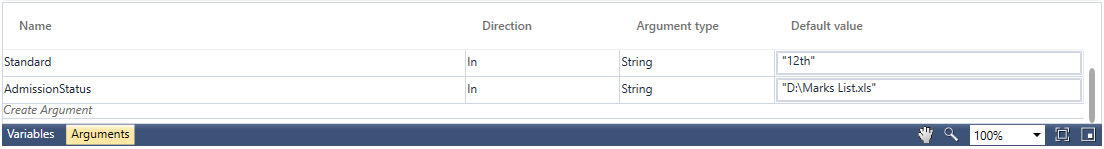
- Create an In argument, Standard and AdmissionStatus. Define Argument type as String. These arguments are used to provide input and store the datatable output.
- Define Default Value for Standard as 12th and AdmissionStatus as D:\Marks List.xls respectively.
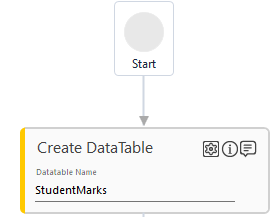
- From the Canvas Tools panel, add Create Datatable to the Flowchart designer on the Canvas.
- In the Datatable Name field, enter StudentMarks.
- Click the
 (Settings) icon. The Columns Definition window appears.
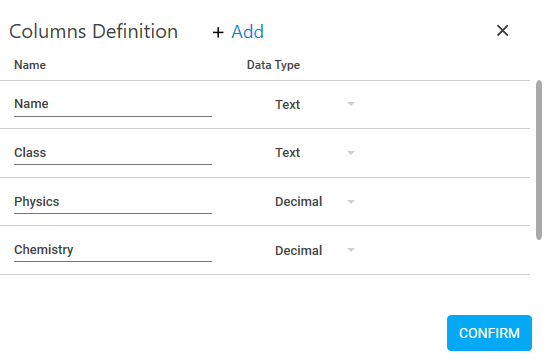
- Click Add. Enter Name in the Name column, and select Data Type as Text from the list.
- Click Add. Enter Class in the Name column, and select Data Type as Text from the list.
- Click Add. Enter Physics in the Name column, and select Data Type as Decimal from the list.
- Click Add. Enter Chemistry in the Name column, and select Data Type as Decimal from the list.
- Click Add. Enter Math in the Name column, and select Data Type as Decimal from the list.
- Click CONFIRM.
|
NOTE: |
Since the marks is captured in decimal, the Data Type selected for Physics, Chemistry, and Math is Decimal. |
- From the Canvas Tools panel, add Add Row to the Flowchart designer on the Canvas.
- In the Datatable Name list, select StudentsMarks.

- Click the (Settings) icon. The Add Row Mapping window appears.
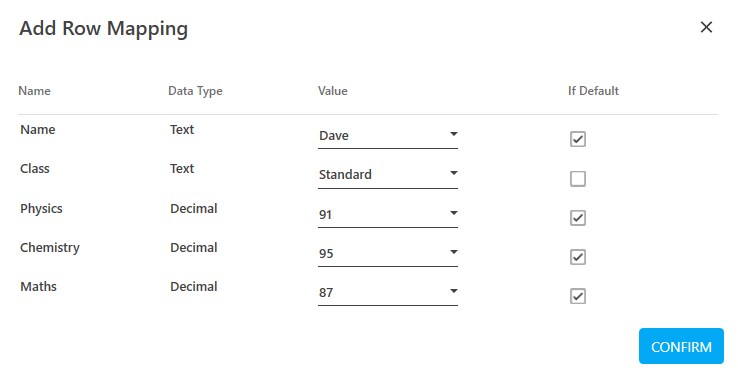
- In the Name row, enter the value in the Value field.
- In the Class row, select Standard from the Value list and clear If Default checkbox.
- In the Physics row, enter the value in the Value field.
- In the Chemistry row, enter the value in the Value field.
- In the Maths row, enter the value in the Value field.
- Click CONFIRM.
|
NOTE: |
In the Value field, enter the value and select the If Default checkbox to set it as the default value. Alternatively, In the Value list, select a parameter that holds the value. You must define the parameter in the Parameter bar to use this option. |
- Follow steps 7 through 9 to add student’s details.
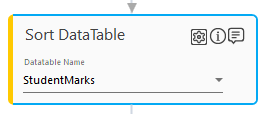
- From the Canvas Tools panel, add Sort DataTable to the Flowchart designer on the Canvas.
- In the Datatable Name list, select StudentMarks.
- Click the (Settings) icon. The Columns Definition window appears.
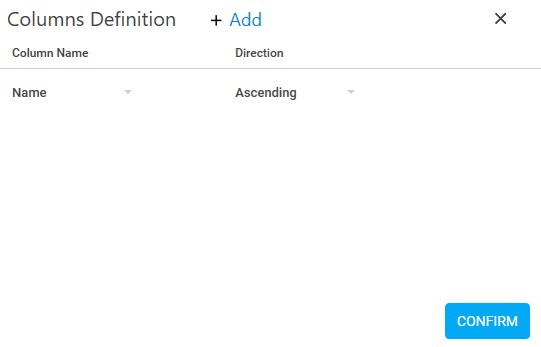
- In the Column Name list, select Name.
- In the Direction list, select Ascending.
|
NOTE: |
The student name is sorted in the alphabetical order. |
- Click CONFIRM.
To view the output of this example, use Export DataTable activity.
- From the Canvas Tools panel, add Export DataTable to the Flowchart designer on the Canvas.
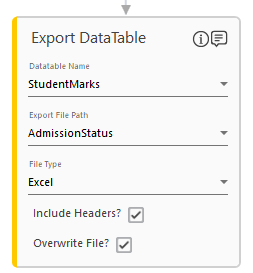
- In the Datatable Name list, select StudentMarks.
- In the Export File Path list, select AdmissionStatus. As defined in the arguments, the AdmissionStatus indicates the file path.
- In the File Type list, select Excel.
- Select Include Headers? and Overwrite File? Options.
- Click Save. The Save Process window appears.
- Enter the Process Name, and click SAVE.
- Setup the environment, and then perform test run.
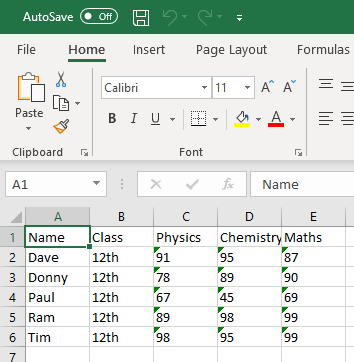
The output is generated and placed at the specified file path location. You can open the Marks List excel to view the data.