Engage User Dashboard
Following reports are available in the Engage User Dashboard:
User wise execution
- The number of search requests done for each user per process.
- Average time spent by each user for each of the process and average time spent gives details of average search time and average time spent on other activities before another request is executed.
- Service level defined against each process and the percentage of requests that are executed within SLA adherence for all users across all processes.
Following table provides the report fields description.
|
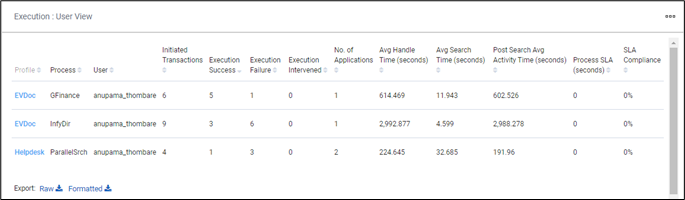
Execution: User View |
|
|
Field Name |
Description |
|
Profile |
Indicates the name of the profile. |
|
Process |
Indicates the name of the process. |
|
User |
Indicates the name of the user working on the process. |
|
Initiated Transactions |
Indicates the total number of transactions initiated in that particular process. |
|
Execution Success |
Indicates the total number of transactions that were successful in that particular process. |
|
Execution Failure |
Indicates the total number of transactions that were failed in that particular process. |
|
Execution Intervened |
Indicates the number of transactions that were initiated but could not be completed. |
|
No. of Applications |
Indicates the total number of applications in which automation is done for a process. |
|
Avg Handle Time (seconds) |
Indicates the average time spent on all the transactions. |
|
Avg Search Time (seconds) |
Indicates the average automation time spent across all the transactions. |
|
Post Search Avg Activity Time (seconds) |
Indicates the time spent on the process, once the search is completed and the next search is started. |
|
Process SLA (seconds) |
Indicates the expected execution time configured in Studio. |
|
SLA Compliance |
Indicates the percentage of time it adheres to the SLA. |
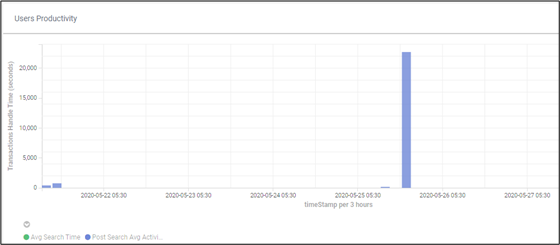
Users Productivity
A consolidated user productivity view which details of time spent in execution and time spent on other activities. This Metrix can give insights on user time spent trends daily, weekly or monthly.
Following table provides the report fields description.
|
Users Productivity |
|
|
Field Name |
Description |
|
Transaction Handle Time |
Indicates the average time required (in seconds) per transaction that includes execution time and time spent on other activities. |
|
timeStamp per 3 hours |
Displays the date and time when the data was captured at a duration of every three hours. |
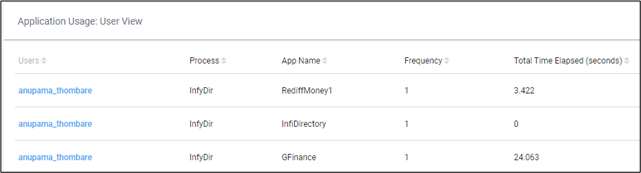
Application Usage: User View
The time spent by user on the integrated applications with the platform within each profile helps conclude the usage of the applications which are integrated.
Following table provides the report fields description.
|
Application Usage: User view |
|
|
Field Name |
Description |
|
User |
Indicates the name of the user working on the process. |
|
Process |
Indicates the name of the process’s user has worked on. |
|
App Name |
Indicates the names of the applications on which the user has worked on. |
|
Frequency |
Indicates the number of times the application is visited. |
|
Total Time Elapsed (seconds) |
Indicates the total time (in seconds) spent on the application. |