Dashboard
A dashboard is a collection of visualizations. Dashboards provide at-a-glance insights into your data and enable you to drill down into details.
To access dashboards, default se-actvttrack-1* index pattern should be added to retrieve all the operational data from the transaction store. For more information about importing the Json files, see Configuring Kibana Reports Using .json Files section in Installation guide.
Prerequisite
Logged in user role should have relevant permission to edit or view the dashboard. For more information about the role access, see Page Access.
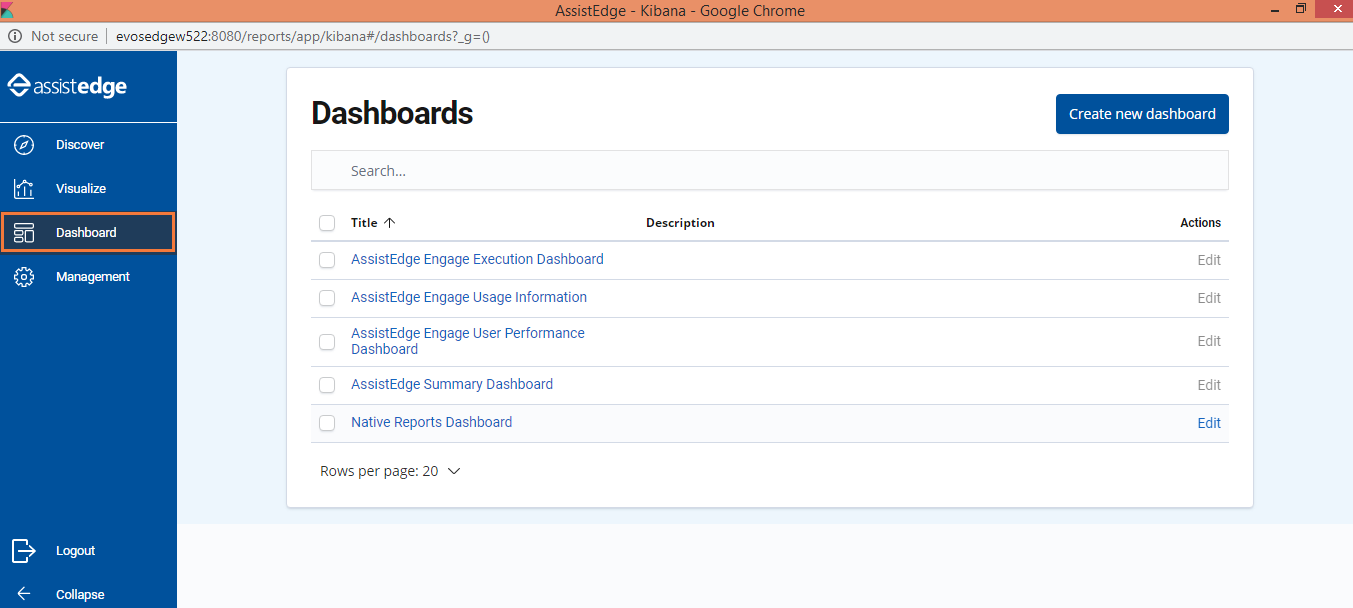
Accessing Dashboard
To access the dashboard page, login to Admin Module:
Navigate to Reporting > Dashboard.
Adding Filter
Follow the below steps if you want to apply filter on the data that is displayed in the reports.
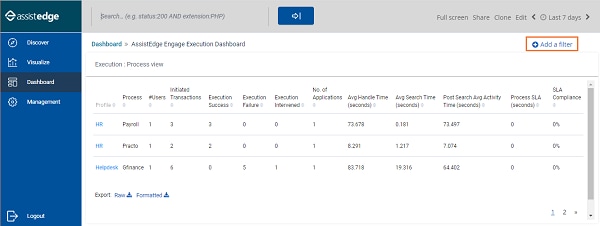
1. Click the desired dashboard link on the Dashboard home page.
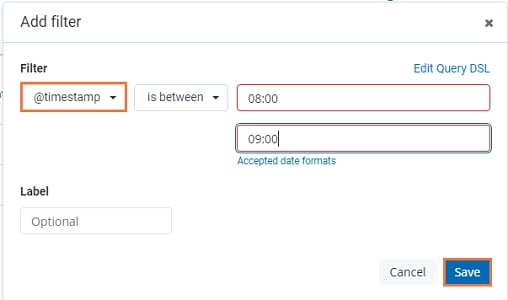
2. Click Add a filter.
The Add filter window appears. Select the required filter, enter the inputs, and click Save.
· In the Filter drop-down list, select the required filter criteria. Based on the selected criteria, the other fields appear where you can provide the inputs.
Based on the applied filter, the data is displayed in the generated report.
If any time filter is applied, transactions for the applied time filter is shown. For example, time filter is applied to view data from 08:00 till 09:00 and no transactions will have initiated in this duration thus initiated transactions would show zero, however if any transaction initiated before 08:00 and gets executed at 08:15 will come under execution success, execution failure or execution intervened based on transaction output however it is not reflected under Initiated Transactions for the applied time filter.
NOTE: |
Filter Data: Filter should always be applied on Transaction ID field to extract data. If filter is applied on any other field than transaction id, then according to applied filter only partial data is shown. |
Out-of-the-Box Dashboards
Click the preferred dashboard to view the corresponding operational insights. Dashboard tab displays the following out-of-the-box dashboards. Click the link below to view the details:
· AssistEdge Engage Execution Dashboard
· AssistEdge Summary Dashboard
· AssistEdge Engage User Performance Dashboard
On This Page Hide
Related Topics